
June 19, 2026 a 03:15 pm
YUM: Fibonacci Analysis - Yum! Brands, Inc.
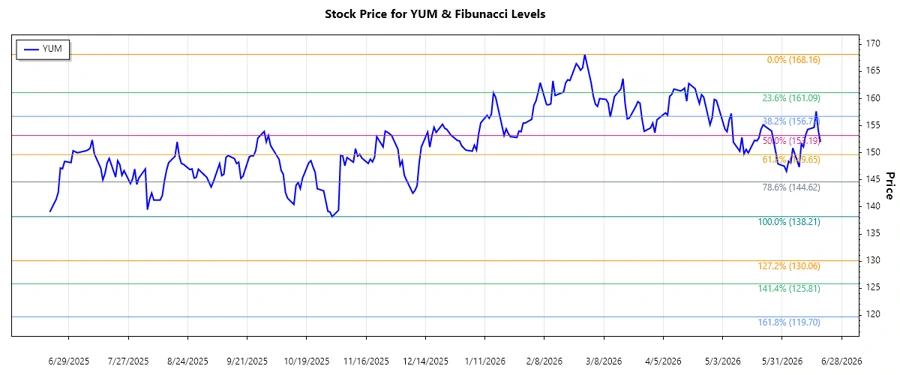
Yum! Brands, Inc. (YUM) exhibits robust brand positioning within the quick-service restaurant industry, leveraging a diversified portfolio with major franchises like KFC, Taco Bell, and Pizza Hut. The retracement analysis shows market dynamics influencing the stock price recently, with a dominant downward trend being evident. The technical indicators suggest that the stock could be nearing a potential reversal zone after the recent downward movement.
Fibonacci Analysis
| Details | Information |
|---|---|
| Trend Start Date | 2025-12-10 |
| Trend End Date | 2026-06-18 |
| High Price (Date) | $168.16 (2026-02-27) |
| Low Price (Date) | $138.21 (2025-10-31) |
| Fibonacci Levels |
|
| Current Retracement Zone | 0.382 |
| Technical Interpretation | The current price is in the 0.382 retracement zone, suggesting a potential support level. A bounce from this level could indicate a reversal. |
Conclusion
The current technical indicators suggest that Yum! Brands, Inc. stock may find support near its recent Fibonacci retracement levels. Sustaining above the 0.382 retracement level can be crucial for the resumption of an uptrend. However, breaching below can lead to further downward pressure, marking the need for cautious positioning. As Yum! continues to expand its global franchise operations amidst emerging market dynamics, maintaining flexibility in response to these technical cues could prove beneficial. Investors are advised to monitor support levels and broader market conditions before making any decisions.
Smart Data Insight
Master the Perfect Entry & Exit for this Stock
Don't leave your profits to chance. Historically, this stock follows specific seasonal patterns that institutional traders use to maximize returns.
- ✅ Identify the "Golden Buying Window"
- ✅ Avoid high-risk correction cycles
- ✅ Backtested data from the last 20+ years