January 23, 2026 a 11:44 am

YUM: Fibonacci Analysis - Yum! Brands, Inc.
Yum! Brands, Inc. has shown a strong upward trend over recent months. With its diverse restaurant portfolio, including KFC, Taco Bell, and Pizza Hut, the company has maintained steady growth. This analysis focuses on the recent trend to assess potential retracement levels and highlight strategic opportunities and risks.
Fibonacci Analysis
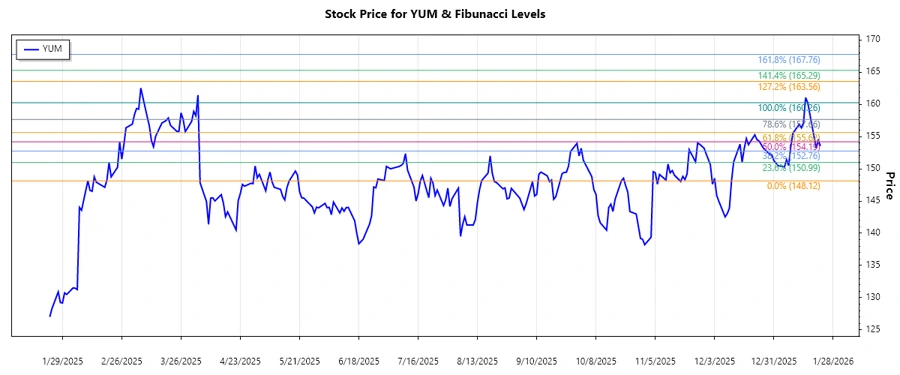
Based on the data, an upward trend has been observed from October 31, 2025, through January 22, 2026.
| Description | Date | Price |
|---|---|---|
| Trend Start | 2025-10-31 | 138.21 |
| Trend End | 2026-01-22 | 153.53 |
| High Point | 2026-01-16 | 160.26 |
| Low Point | 2025-12-11 | 148.12 |
| Fibonacci Level | Price Level |
|---|---|
| 0.236 | 152.10 |
| 0.382 | 150.05 |
| 0.5 | 148.69 |
| 0.618 | 147.33 |
| 0.786 | 145.41 |
The current price is 153.53, which is above the Fibonacci retracement levels. This suggests that the stock is not within any specific retracement zone, indicating continued strength in the current upward trend. This level may serve as a resistance if the price fails to break and sustain above this level in future trading sessions.
Conclusion
Yum! Brands, Inc. exhibits a solid upward trend, demonstrating potential for further gains. The current pricing above Fibonacci levels signals strong bullish momentum. However, there's a risk of the price revisiting lower retracement zones in the event of market volatility. Analysts should closely monitor for any breakout above the current levels to capitalize on potential upward movement or manage risks if the trend reverses.