January 17, 2026 a 03:31 am


YUM: Dividend Analysis - Yum! Brands, Inc.
Yum! Brands, Inc. showcases a robust dividend profile, marked by a consistent history of dividend payments over 22 years. The company's strategic focus on maintaining dividend stability and moderate growth presents an attractive opportunity for dividend-seeking investors. With a current dividend yield of approximately 1.92%, Yum!'s commitment to shareholder returns is evident, although recent payout ratios suggest a need for cautious optimism.
📊 Overview
As a key player in the Restaurant sector, Yum! Brands, Inc. maintains a dividend yield of 1.92%, with a current dividend per share of $2.67. The company boasts a remarkable dividend history spanning 22 years, with the last cut or suspension in 2017. This track record underscores Yum!'s dedication to its dividend policy, appealing to income-focused investors.
| Key Metrics | Details |
|---|---|
| Sector | Restaurant |
| Dividend Yield | 1.92% |
| Current Dividend per Share | $2.67 |
| Dividend History | 22 years |
| Last Cut or Suspension | 2017 |
🗣️ Dividend History
Tracking dividend history is crucial for understanding a company's commitment to returning value to shareholders. Yum! Brands, Inc. has demonstrated a consistent approach to dividend payouts, reflecting its operational stability and management's confidence in long-term cash flow generation.
| Year | Dividend per Share (USD) |
|---|---|
| 2025 | $2.84 |
| 2024 | $2.68 |
| 2023 | $2.42 |
| 2022 | $2.28 |
| 2021 | $2.00 |
📈 Dividend Growth
Analyzing dividend growth is vital for assessing a company's future payout potential. Yum! Brands has shown consistent dividend growth, recording a growth of approximately 7.60% over the past three years and 8.60% over five years.
| Time | Growth |
|---|---|
| 3 years | 7.60% |
| 5 years | 8.60% |
The average dividend growth is 8.60% over 5 years. This shows moderate but steady dividend growth, indicative of Yum!'s strategic financial planning.
✅ Payout Ratio
Understanding payout ratios helps assess the sustainability of dividend payments. Yum! Brands exhibits an EPS-based payout ratio of 51.23% and a free cash flow-based payout ratio of 47.28%. These figures suggest that the company maintains a balanced approach, focusing on both shareholder returns and reinvestment opportunities.
| Key Figure | Ratio |
|---|---|
| EPS-based | 51.23% |
| Free Cash Flow-based | 47.28% |
The relatively conservative payout percentages imply sufficient retained earnings to support company growth and debt obligations.
⚠️ Cashflow & Capital Efficiency
Cashflow and capital efficiency indicators are vital for ensuring continued operational success and covering dividends. The evaluation includes key ratios that reflect Yum!'s cash generation capability and capital utilization.
| Metric | 2024 | 2023 | 2022 |
|---|---|---|---|
| Free Cash Flow Yield | 3.79% | 3.59% | 3.13% |
| Earnings Yield | 3.93% | 4.35% | 3.62% |
| CAPEX to Operating Cash Flow | 15.22% | 17.78% | 19.55% |
| Stock-based Compensation to Revenue | 0.91% | 1.34% | 1.23% |
| Free Cash Flow / Operating Cash Flow Ratio | 84.78% | 82.22% | 80.45% |
Yum!'s cashflow and capital efficiency metrics indicate a stable cashflow with carefully managed operational expenditures.
📉 Balance Sheet & Leverage Analysis
A balance sheet analysis is essential for understanding financial stability, liquidity, and degree of leverage. Yum!'s debt ratios demonstrate a higher leverage, although interest coverage remains adequate.
| Metric | 2024 | 2023 | 2022 |
|---|---|---|---|
| Debt-to-Equity | -1.61 | -1.53 | -1.43 |
| Debt-to-Assets | 1.83 | 1.93 | 2.17 |
| Debt-to-Capital | 2.65 | 2.88 | 3.35 |
| Net Debt to EBITDA | 4.55 | 4.64 | 5.27 |
| Current Ratio | 0 | 1.26 | 0.97 |
| Quick Ratio | 1.47 | 1.26 | 0.97 |
| Financial Leverage | -0.88 | -0.79 | -0.66 |
The leverage profile suggests a high reliance on debt, yet proactive management of interest obligations safeguards financial stability.
✅ Fundamental Strength & Profitability
Key profitability metrics provide insights into Yum!'s operational efficiency and income generation capability. The company's margins underscore strong market positioning and effective cost management.
| Metric | 2024 | 2023 | 2022 |
|---|---|---|---|
| Return on Equity | -19.43% | -20.32% | -14.93% |
| Return on Assets | 22.09% | 25.63% | 22.67% |
| Margins: Net | 19.68% | 22.57% | 19.37% |
| Margins: Gross | 47.48% | 49.41% | 48.33% |
| Margins: EBIT | 31.65% | 32.94% | 31.99% |
| Margins: EBITDA | 33.96% | 35.10% | 34.13% |
| Research & Development to Revenue | 0% | 0% | 0% |
Although zero investment is observed in R&D, efficient use of other resources enables competitive profitability ratios.
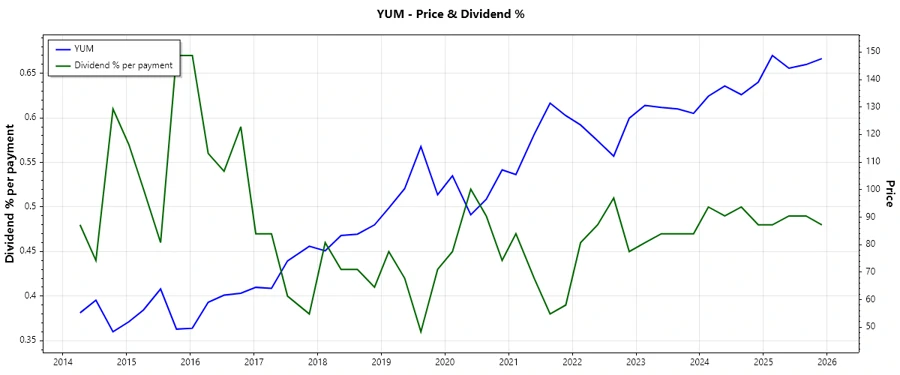
📈 Price Development
Dividend Scoring System
| Category | Score (1-5) | Score Bar |
|---|---|---|
| Dividend Yield | 3 | |
| Dividend Stability | 4 | |
| Dividend Growth | 4 | |
| Payout Ratio | 3 | |
| Financial Stability | 3 | |
| Dividend Continuity | 4 | |
| Cashflow Coverage | 3 | |
| Balance Sheet Quality | 3 |
Overall Score: 27/40
📈 Rating
Yum! Brands, Inc. presents a solid income investment opportunity with its reliable dividend profile and balanced financial management. While room for improvement in leverage management exists, the consistent dividend history and moderate growth potential reinforce Yum! Brands as a compelling choice for investors seeking income stability.