October 28, 2025 a 02:46 am
YUM: Dividend Analysis - Yum! Brands, Inc.
Yum! Brands, Inc. has a stable track record of dividend payouts, offering moderate yields with a history of consistent growth over the years. The company operates in the restaurant industry and has shown resilience in maintaining its dividend policy, even amid sector-specific challenges. However, the current market dynamics demand a close look at cash flow stability and payout sustainability.
📊 Overview
Yum! Brands stands out in the restaurant sector with its commitment to maintaining and growing dividends over 22 consecutive years. The dividend yield stands at 1.93%, reflecting its strategy to return a portion of earnings to shareholders amidst its competitive industry.
| Criteria | Details |
|---|---|
| Sector | Restaurants |
| Dividend yield | 1.93% |
| Current dividend per share | 2.67 USD |
| Dividend history | 22 years |
| Last cut or suspension | None |
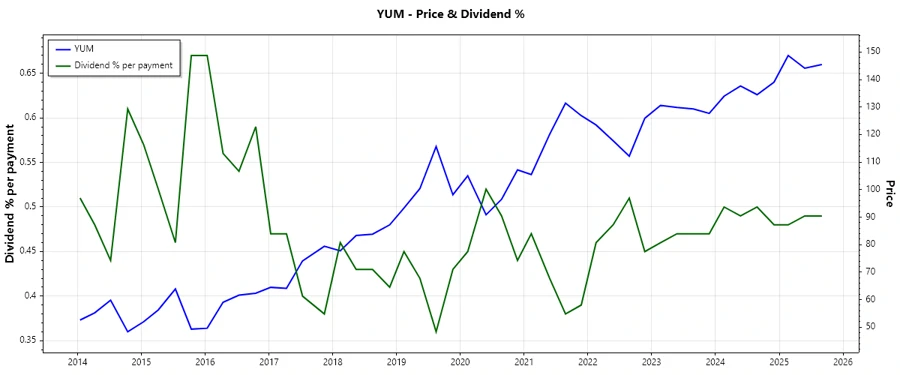
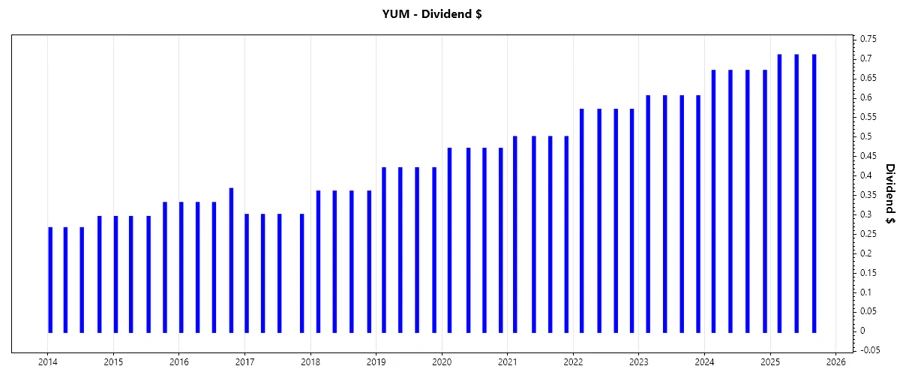
📈 Dividend History
The dividend history of Yum! Brands demonstrates a robust commitment to shareholders. Over 22 years, the company has consistently increased its dividend payouts, a signal of strong underlying profit growth and management's dedication to distributing earnings responsibly.
| Year | Dividend per share (USD) |
|---|---|
| 2025 | 2.13 |
| 2024 | 2.68 |
| 2023 | 2.42 |
| 2022 | 2.28 |
| 2021 | 2.00 |
📈 Dividend Growth
Understanding dividend growth is critical as it highlights a company’s ability to increase shareholder returns over time. Yum! Brands reports an average dividend growth rate of 9.79% over the past 5 years, signaling moderate but steady growth.
| Time | Growth |
|---|---|
| 3 years | 10.25% |
| 5 years | 9.79% |
The average dividend growth is 9.79% over 5 years. This shows moderate but steady dividend growth.
🗣️ Payout Ratio
The payout ratio is a key financial metric used to determine the sustainability of a company’s dividend payments. It shows the company’s ability to continue to pay dividends to its shareholders.
| Key figure | Ratio |
|---|---|
| EPS-based | 51.96% |
| Free cash flow-based | 48.18% |
The EPS-based payout ratio at 51.96% and FCF-based payout ratio at 48.18% point towards a healthy balance, allowing dividends to be covered comfortably by earnings and cash flow, indicating a sustainable policy.
➡️ Cashflow & Capital Efficiency
Cash flow and capital efficiency are essential indicators of a company's financial health and its ability to fund operations, pursue growth opportunities, and return value to shareholders.
| Metric | 2024 | 2023 | 2022 |
|---|---|---|---|
| Free Cash Flow Yield | 3.79% | 3.59% | 3.13% |
| Earnings Yield | 3.93% | 4.35% | 3.62% |
| CAPEX to Operating Cash Flow | 15.22% | 17.78% | 19.55% |
| Stock-based Compensation to Revenue | 0.91% | 1.34% | 1.23% |
| Free Cash Flow / Operating Cash Flow Ratio | 84.78% | 82.22% | 80.45% |
The cash flow stability and high capital efficiency ratios suggest Yum! Brands effectively manages its capital with high returns. The Return on Invested Capital (ROIC) highlights its strong capital allocation.
🔍 Balance Sheet & Leverage Analysis
Analyzing the balance sheet helps in understanding a company's financial stability and how effectively it uses debt to finance operations and grow shareholder value.
| Metric | 2024 | 2023 | 2022 |
|---|---|---|---|
| Debt-to-Equity | -1.61 | -1.53 | -1.43 |
| Debt-to-Assets | 1.83 | 1.93 | 2.17 |
| Debt-to-Capital | 2.65 | 2.88 | 3.35 |
| Net Debt to EBITDA | 4.55 | 4.64 | 5.27 |
| Current Ratio | 1.47 | 1.26 | 0.97 |
| Quick Ratio | 1.47 | 1.26 | 0.97 |
| Financial Leverage | -0.88 | -0.79 | -0.66 |
The leverage ratios and current ratios indicate that Yum! Brands maintains financial flexibility, although a negative debt-to-equity ratio suggests reliance on debt financing. This requires close monitoring to mitigate potential liquidity risks.
💪 Fundamental Strength & Profitability
Fundamental strength and profitability measures help investors understand how effectively the company generates profits relative to its equity, assets, and invested capital.
| Metric | 2024 | 2023 | 2022 |
|---|---|---|---|
| Return on Equity | -19.43% | -20.32% | -14.93% |
| Return on Assets | 22.09% | 25.63% | 22.67% |
| Margins: Net | 19.68% | 22.57% | 19.37% |
| EBIT Margin | 31.65% | 32.94% | 31.99% |
| EBITDA Margin | 33.96% | 35.10% | 34.13% |
| Gross Margin | 47.48% | 49.41% | 48.33% |
| Research & Development to Revenue | 0% | 0% | 0% |
The return on assets reflects efficient asset utilization, while high operating margins highlight operational efficiency. Yet, negative return on equity signals potential equity performance issues owing to leverage.
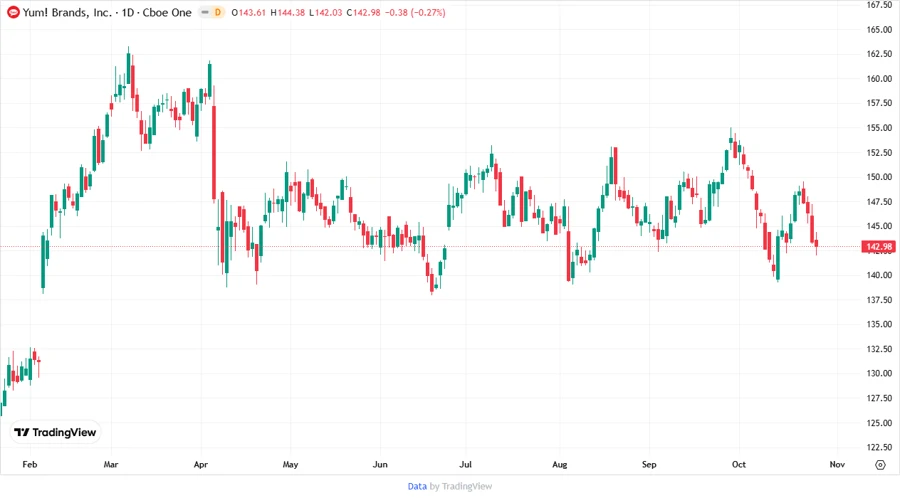
📉 Price Development
🧮 Dividend Scoring System
| Category | Score | Score Bar |
|---|---|---|
| Dividend yield | 3 | |
| Dividend Stability | 5 | |
| Dividend growth | 4 | |
| Payout ratio | 4 | |
| Financial stability | 3 | |
| Dividend continuity | 5 | |
| Cashflow Coverage | 4 | |
| Balance Sheet Quality | 3 |
Total Score: 31/40
✅ Rating
Yum! Brands, Inc. receives a robust dividend score, reflecting a solid dividend policy with reliable growth and continuity in payments. Despite signs of leverage, the strong cash flow and dividend coverage suggest continuing attractiveness for income-focused investors. Investors should keep an eye on leverage levels while enjoying yields and growth prospects.
Smart Data Insight
Master the Perfect Entry & Exit for this Stock
Don't leave your profits to chance. Historically, this stock follows specific seasonal patterns that institutional traders use to maximize returns.
- ✅ Identify the "Golden Buying Window"
- ✅ Avoid high-risk correction cycles
- ✅ Backtested data from the last 20+ years