May 18, 2026 a 05:15 am
XYZ: Fibonacci Analysis - Block, Inc.
Block, Inc. has shown resilience in the financial technology market, continuously expanding its offerings to cater to diverse business needs. Despite market volatility, the company has maintained its position as a leader in payment solutions. As we delve into the recent trends, a thorough Fibonacci analysis provides insight into potential price retracements and levels of support.
Fibonacci Analysis
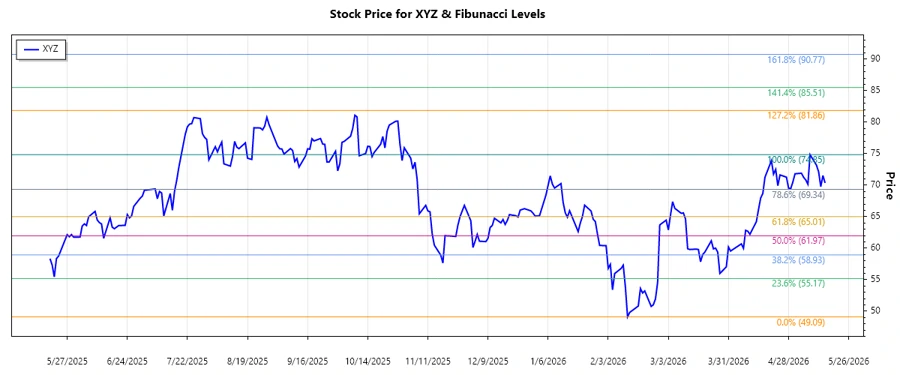
The recent dominant trend identified in Block, Inc.'s stock (Ticker: XYZ) is an uptrend, starting from a price of $49.09 on February 12, 2026, reaching a high of $74.85 on May 8, 2026. This upward momentum highlights investor confidence and market demand. The following Fibonacci Retracement Levels have been calculated based on this trend:
| Fibonacci Level | Price Level |
|---|---|
| 0.236 | $65.14 |
| 0.382 | $60.53 |
| 0.5 | $56.97 |
| 0.618 | $53.41 |
| 0.786 | $48.28 |
The current price of Block, Inc. stands at $70.36, which hovers above the 0.236 Fibonacci retracement level, indicating it is not currently within a major retracement zone. This suggests potential support above this level, although downward corrections may test these emergent support levels.
Analysis Conclusion: The technical indicators suggest Block, Inc.'s price is maintaining above key retracement levels, implying the possibility of continued strength or consolidation around current levels, with $65.14 acting as a key support threshold. Investors should watch for reactions at these points which could provide further directional cues.
Conclusion
Block, Inc. showcases robust performance, driven by its diverse product offerings in the fintech space. The recent uptrend and results from the Fibonacci analysis suggest bullish sentiment, but investors should remain vigilant for signs of resistance near calculated retracement levels. With emerging support, Block, Inc.'s stock demonstrates potential for continuity in upward trajectory but may face volatility amid economic uncertainties. Long-term prospects remain promising, albeit with short-term risks tied to broader market fluctuations and sectoral competition.
Smart Data Insight
Master the Perfect Entry & Exit for this Stock
Don't leave your profits to chance. Historically, this stock follows specific seasonal patterns that institutional traders use to maximize returns.
- ✅ Identify the "Golden Buying Window"
- ✅ Avoid high-risk correction cycles
- ✅ Backtested data from the last 20+ years