November 01, 2025 a 04:03 am
XYL: Trend and Support & Resistance Analysis - Xylem Inc.
Xylem Inc., a leader in water technology and smart solutions, shows promising growth in the water infrastructure sector. With strong international operations and innovative services, the stock has demonstrated robust recovery trends. Recent technical indicators imply a sustainable upward momentum, making it an attractive consideration for long-term investment portfolios.
Trend Analysis
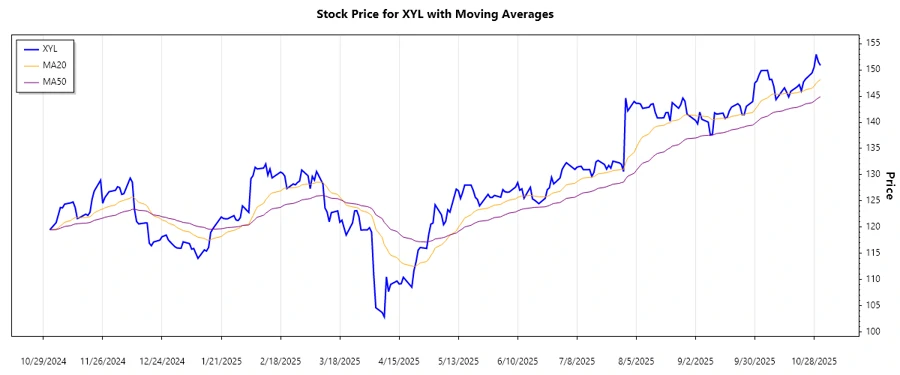
The calculated EMAs indicate a clear trend pattern. Recent data suggests a potential upward momentum, as the EMA20 currently surpasses the EMA50.
| Date | Closing Price | Trend Indicator (▲/▼/⚖️) |
|---|---|---|
| 2025-10-31 | 150.85 | ▲ |
| 2025-10-30 | 151.53 | ▲ |
| 2025-10-29 | 152.95 | ▲ |
| 2025-10-28 | 150.5 | ▲ |
| 2025-10-27 | 149.4 | ▲ |
| 2025-10-24 | 148.25 | ▲ |
| 2025-10-23 | 147.69 | ▲ |
Technical analysis suggests a firm upward trajectory, indicating the potential for continued gains.
Support and Resistance
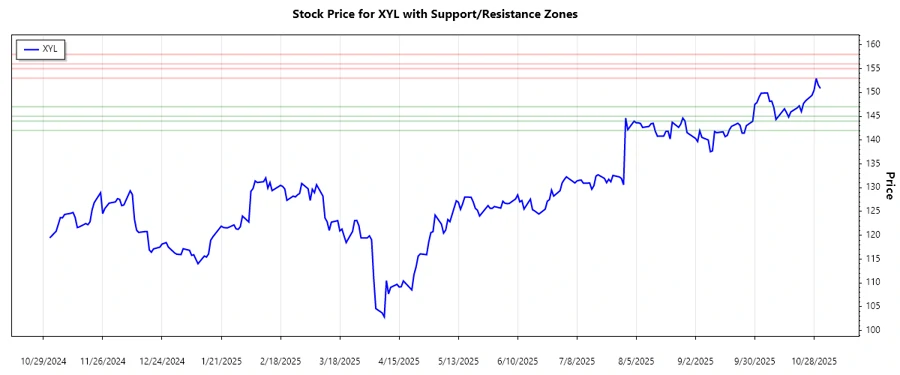
Analysis of recent price action reveals key support and resistance levels critical for future price moves.
| Zone | From | To | Direction |
|---|---|---|---|
| Support 1 | 145.00 | 147.00 | ↓ |
| Support 2 | 142.00 | 144.00 | ↓ |
| Resistance 1 | 153.00 | 155.00 | ↑ |
| Resistance 2 | 156.00 | 158.00 | ↑ |
The current price is close to breaking through the first resistance zone, signaling potential continued upward movement.
Conclusion
Xylem Inc.'s stock shows strong upward momentum backed by solid technical indicators. The upward trend and proximity to resistance levels suggest the possibility of a continued increase in share value. Investors should consider the potential upside in this market sector while keeping an eye on support levels for entries. Preserving this growth trajectory requires monitoring both internal (company performance) and external macroeconomic factors. As long as these trends sustain, Xylem's stock offers a significant investment opportunity.
Smart Data Insight
Master the Perfect Entry & Exit for this Stock
Don't leave your profits to chance. Historically, this stock follows specific seasonal patterns that institutional traders use to maximize returns.
- ✅ Identify the "Golden Buying Window"
- ✅ Avoid high-risk correction cycles
- ✅ Backtested data from the last 20+ years