August 30, 2025 a 03:15 am
XYL: Trend and Support & Resistance Analysis - Xylem Inc.
Xylem Inc. has shown variability in its stock price over recent periods, with trends indicating a tendency towards recovery and growth. The innovative strategies in water infrastructure and smart control solutions likely bolster its market standing. However, vigilance is required due to fluctuations possibly stemming from global economic conditions.
Trend Analysis
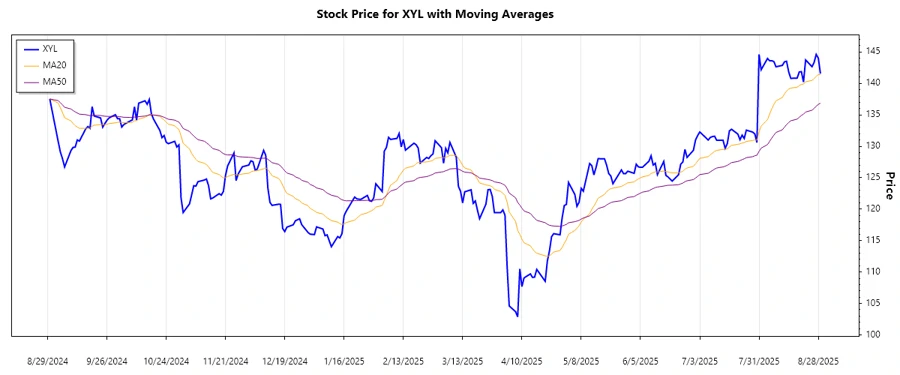
The trend analysis for Xylem Inc. shows a mixed trajectory with signs of recovery. Analyzing the data, the EMA20 and EMA50 have been pivotal in understanding the trend direction. The EMA calculations showed a higher EMA20 than EMA50 over the last few periods, indicating an ▲ uptrend.
| Date | Closing Price | Trend |
|---|---|---|
| August 29, 2025 | $141.56 | ▲ |
| August 28, 2025 | $144.01 | ▲ |
| August 27, 2025 | $144.62 | ▲ |
| August 26, 2025 | $143.34 | ▲ |
| August 25, 2025 | $142.67 | ▲ |
| August 22, 2025 | $143.74 | ▲ |
| August 21, 2025 | $140.22 | ▼ |
Technically, Xylem Inc. appears to be in a short-term uptrend, which might be indicative of favorable market conditions or successful strategic endeavors.
Support and Resistance
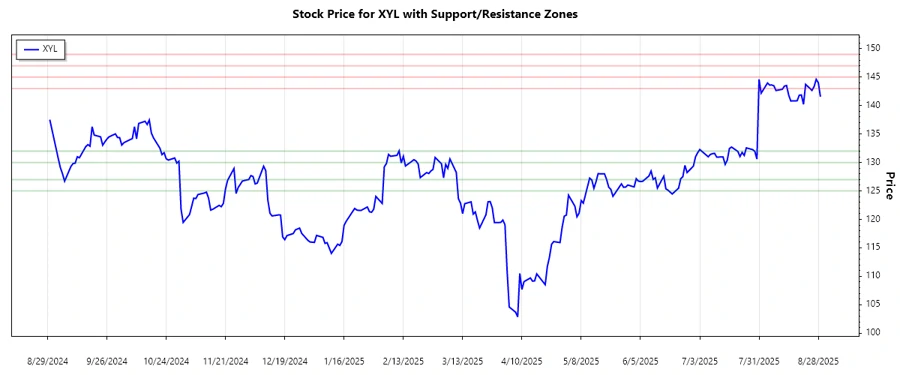
Based on the historical data, key support and resistance zones have been identified, which provide insight into potential price ceilings and floors.
| Zone Type | From | To |
|---|---|---|
| Support Zone 1 | $130.00 | $132.00 |
| Support Zone 2 | $125.00 | $127.00 |
| Resistance Zone 1 | $143.00 | $145.00 |
| Resistance Zone 2 | $147.00 | $149.00 |
The current price of $141.56 places the stock near the resistance zone, suggesting potential testing of this boundary in the short term.
Conclusion
Xylem Inc.'s recent trading activity indicates a solid upward momentum, underpinned by favorable technical indicators. The proximity to resistance zones implies potential for either a breakout or retracement. While the optimistic trend offers growth potential, market participants should remain aware of broader market volatilities that could impact this trajectory. Continual monitoring of support levels can help manage risk, providing defined exit points should the trend reverse.
Smart Data Insight
Master the Perfect Entry & Exit for this Stock
Don't leave your profits to chance. Historically, this stock follows specific seasonal patterns that institutional traders use to maximize returns.
- ✅ Identify the "Golden Buying Window"
- ✅ Avoid high-risk correction cycles
- ✅ Backtested data from the last 20+ years