May 19, 2026 a 04:44 pm
XYL: Fibonacci Analysis - Xylem Inc.
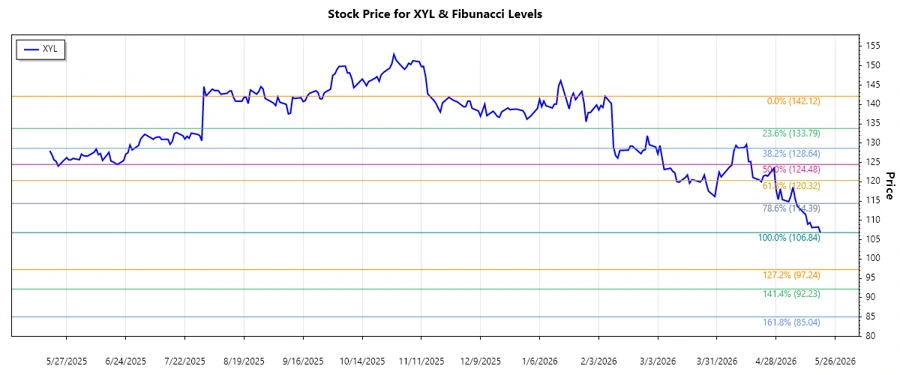
Xylem Inc. has experienced a noticeable downtrend over the past months, highlighting the volatility in the water infrastructure sector. As the company navigates challenges in production and distribution worldwide, its stock price reflects broader market pressures. Despite recent declines, Xylem's innovative solutions in water technology position it strategically for long-term growth. The technical analysis suggests potential levels for price corrections or rebounds.
Fibonacci Analysis
| Data Point | Date | Price |
|---|---|---|
| Start of Trend | 2026-02-06 | 142.12 |
| End of Trend | 2026-05-19 | 106.84 |
| High | 2026-02-06 | 142.12 |
| Low | 2026-05-19 | 106.84 |
| Fibonacci Level | Price |
|---|---|
| 0.236 | 133.03 |
| 0.382 | 128.51 |
| 0.5 | 124.48 |
| 0.618 | 120.44 |
| 0.786 | 115.45 |
The current price of 108.30 sits below the 0.786 Fibonacci level, indicating that the stock is in a potential oversold zone, which may serve as psychological support for a possible rebound.
Conclusion
The technical outlook for Xylem Inc. suggests a strong movement into bearish territory as indicated by recent price declines. However, the stock is currently positioned in a potentially lucrative buy zone if market sentiment shifts or business performance improves. Analysts should watch for signs of a reversal or stabilization at key Fibonacci levels, which could signify a bottom or a point of consolidation. While the company's strategic innovations and global reach provide growth potential, investors must also consider the broader economic impacts and competitive landscape affecting profitability. Risk management remains crucial in navigating potential declines or market volatility.
Smart Data Insight
Master the Perfect Entry & Exit for this Stock
Don't leave your profits to chance. Historically, this stock follows specific seasonal patterns that institutional traders use to maximize returns.
- ✅ Identify the "Golden Buying Window"
- ✅ Avoid high-risk correction cycles
- ✅ Backtested data from the last 20+ years