September 23, 2025 a 04:45 pm
XYL: Fibonacci Analysis - Xylem Inc.
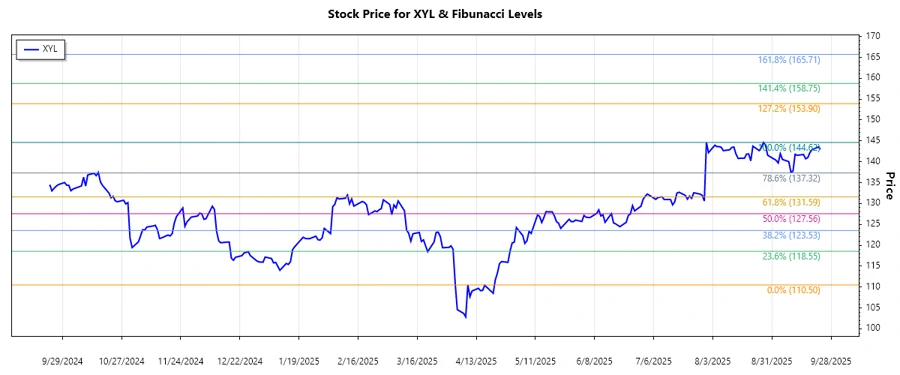
Xylem Inc. (XYL) has demonstrated a substantial uptrend over the past months, reflecting increased investor confidence and strong performance in its core segments. Technical analysis reveals a consistent price increase, suggesting potential robust trend continuation. This growth is supported by innovation in water infrastructure solutions and global expansion initiatives, positioning Xylem as a key player in environmental technology.
Fibonacci Analysis
| Description | Details |
|---|---|
| Trend Start Date | 2025-04-09 |
| Trend End Date | 2025-09-23 |
| High Price Date | 2025-07-31 |
| High Price | $144.62 |
| Low Price Date | 2025-04-09 |
| Low Price | $110.5 |
| Fibonacci Level | Price |
|---|---|
| 0.236 | $117.53 |
| 0.382 | $122.56 |
| 0.500 | $127.56 |
| 0.618 | $132.54 |
| 0.786 | $139.07 |
The current price of XYL is $142.98, which is above the 0.786 Fibonacci level, indicating it is moving towards new resistance. This could suggest a momentary pause before further potential upward movement.
In terms of technical interpretation, the 0.786 level has previously been a point of resistance. Maintaining this level could indicate strength and continuation of the bullish momentum.
Conclusion
Xylem Inc. exhibits strong upward price momentum, with Fibonacci retracement analysis demonstrating a critical interaction at the 0.786 level. Should XYL continue to hold above this level, it could potentially break into new highs, offering a significant opportunity for investors. However, failure to sustain this momentum may invite downside risks as the stock could retreat to lower support levels. Overall, Xylem presents a compelling case for bullish investors, particularly if supported by broader market trends and favorable sector dynamics.