
April 18, 2026 a 07:30 am

XYL: Dividend Analysis - Xylem Inc.
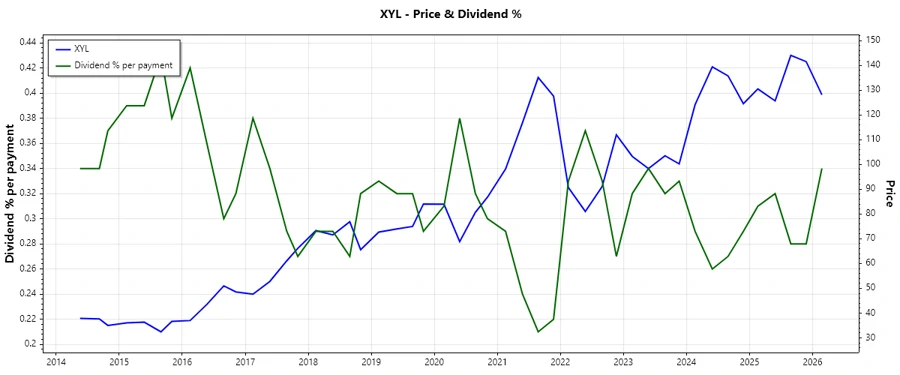
Xylem Inc., a key player in the water technology industry, presents an intriguing investment opportunity with its 1.27% dividend yield. Boasting a 16-year dividend history, Xylem's consistent payouts are indicative of financial resilience. The company positions itself for moderate growth, evidenced by a recent 5-year dividend growth rate of nearly 9%, which aligns with its strategic focus on sustainability and innovation in water solutions.
📊 Overview
Xylem, a sector leader with a strong presence in water technology, offers investors a steady dividend growth story. Despite operating in a challenging sector, it maintains a modest dividend yield of 1.27%, with dividends per share currently at $1.61. The company’s 16-year track record of continuous payments underscores its commitment to delivering shareholder value without recent disruptions.
| Metric | Details |
|---|---|
| Sector | Water Technology |
| Dividend Yield | 1.2721% |
| Current Dividend per Share | 1.61 USD |
| Dividend History | 16 years |
| Last Cut or Suspension | None |
📈 Dividend History
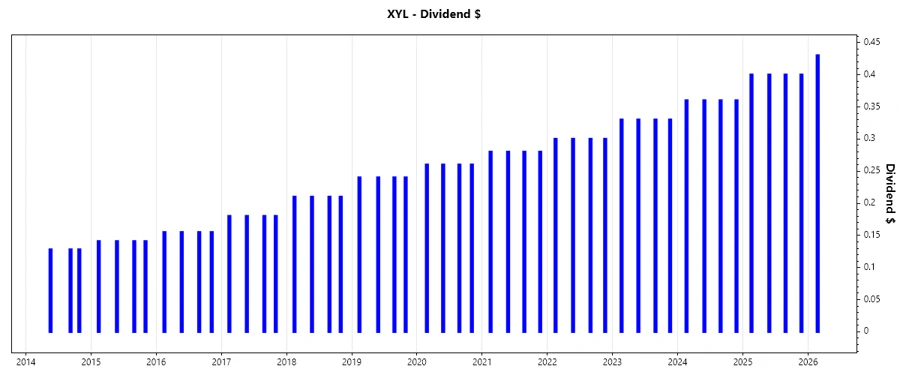
Understanding the historical context of Xylem’s dividend payments is essential for predicting future stability and growth. Historical data indicates resilience through economic cycles. Studying dividend patterns during varied financial conditions provides insights into management’s commitment to returns.
| Year | Dividend per Share (USD) |
|---|---|
| 2026 | 0.43 |
| 2025 | 1.60 |
| 2024 | 1.44 |
| 2023 | 1.32 |
| 2022 | 1.20 |
📊 Dividend Growth
Long-term strategic growth is reflected in Xylem's dividend increments. Such a trend ensures attractive reinvestment options for stakeholders and showcases a commitment to shareholder returns. With a three-year growth of approximately 10.06% and a five-year growth rate of roughly 9%, growth remains consistent.
| Time | Growth |
|---|---|
| 3 years | 10.06% |
| 5 years | 9.00% |
The average dividend growth is 9% over 5 years. This shows moderate but steady dividend growth.
⚖️ Payout Ratio
Analyzing payout ratios is critical in assessing dividend sustainability. Xylem's EPS payout ratio of 40.86% and FCF payout ratio of approximately 42.92% indicate a balance between rewarding shareholders and retaining earnings for reinvestment, which is typical for a company prioritizing both growth and income investors.
| Key figure | Ratio |
|---|---|
| EPS-based | 40.86% |
| Free cash flow-based | 42.92% |
The moderate payout ratios suggest a strategic approach, allowing room for future increases or reinvestment into growth opportunities.
Cashflow & Capital Efficiency
Maintaining robust cash flow and capital efficiency is key to sustaining dividends. This overview highlights critical aspects of Xylem’s capital usage and cash flow management, offering insights into its ability to generate sufficient cash for operations and dividends, and invest in growth with moderate leverage.
| Year | 2025 | 2024 | 2023 |
|---|---|---|---|
| Free Cash Flow Yield | 2.75% | 3.35% | 2.28% |
| Earnings Yield | 2.89% | 3.16% | 2.45% |
| CAPEX to Operating Cash Flow | 26.67% | 25.42% | 32.38% |
| Stock-based Compensation to Revenue | 0.59% | 0.65% | 0.81% |
| Free Cash Flow / Operating Cash Flow Ratio | 73.33% | 74.58% | 67.62% |
Overall, Xylem's cash flow reflects its ability to cover dividends and invest effectively in long-term projects.
Balance Sheet & Leverage Analysis
Solid balance sheet metrics underpin Xylem's dividend potential, showcasing its debt management, liquidity, and financial leverage. Keeping a close watch on these figures helps stakeholders gauge financial stability and growth potential amidst market fluctuations.
| Year | 2025 | 2024 | 2023 |
|---|---|---|---|
| Debt-to-Equity | 16.92% | 19.97% | 23.51% |
| Debt-to-Assets | 11.01% | 12.88% | 14.83% |
| Debt-to-Capital | 14.47% | 16.64% | 19.03% |
| Net Debt to EBITDA | 0.26 | 0.59 | 1.22 |
| Current Ratio | 1.625 | 1.752 | 1.761 |
| Quick Ratio | 1.28 | 1.33 | 1.30 |
| Financial Leverage | 1.54 | 1.55 | 1.58 |
Xylem's effective debt management ensures its capability to navigate fiscal uncertainties while preserving shareholder value.
Fundamental Strength & Profitability
Xylem's operating efficiency and profitability profile offer insights into its ability to generate profits relative to its resources. Steady margins and robust investment returns are critical for sustained financial health.
| Year | 2025 | 2024 | 2023 |
|---|---|---|---|
| Return on Equity | 8.34% | 8.36% | 5.99% |
| Return on Assets | 5.43% | 5.40% | 3.78% |
| Margins: Net | 10.59% | 10.39% | 8.27% |
| Margins: EBIT | 13.39% | 13.21% | 9.29% |
| Margins: EBITDA | 19.76% | 19.77% | 15.21% |
| Margins: Gross | 38.46% | 37.51% | 36.90% |
| Research & Development to Revenue | 2.50% | 2.69% | 3.15% |
Profitability metrics reflect Xylem’s capability to maintain competitive operations and effective reinvestment strategies.
📈 Price Development
🗣️ Dividend Scoring System
| Category | Score | Bar |
|---|---|---|
| Dividend Yield | 3 | |
| Dividend Stability | 4 | |
| Dividend Growth | 3 | |
| Payout Ratio | 4 | |
| Financial Stability | 5 | |
| Dividend Continuity | 4 | |
| Cashflow Coverage | 3 | |
| Balance Sheet Quality | 4 |
Total Score: 30/40
✅ Rating
Xylem Inc. demonstrates a commendable balance of stability and growth potential. With a solid dividend track record and a strategic focus on enhancing shareholder value, it offers an attractive proposition for long-term, income-focused investors. Given its robust financial structure and moderate payout ratios, Xylem is well-positioned to continue its path of moderate growth and consistent dividend payments. Conclusively, for investors seeking exposure to the sustainable water technology sector, Xylem represents a promising investment with steady but assured growth prospects.
Smart Data Insight
Master the Perfect Entry & Exit for this Stock
Don't leave your profits to chance. Historically, this stock follows specific seasonal patterns that institutional traders use to maximize returns.
- ✅ Identify the "Golden Buying Window"
- ✅ Avoid high-risk correction cycles
- ✅ Backtested data from the last 20+ years