
March 08, 2026 a 07:30 am


XYL: Dividend Analysis - Xylem Inc.
Xylem Inc. provides a modest dividend yield of 1.27%, coupled with a consistent and solid dividend history over 16 years. Despite the relatively low yield, the company showcases a stable and growing dividend profile, without suspensions or cuts, which underlines its commitment to returning value to shareholders.
📊 Overview
Analyzing Xylem Inc., the company operates in the water technology sector and provides a dividend yield of 1.27%. With a current dividend of 1.61 USD per share and a reliable dividend history spanning 16 years, it's apparent that Xylem maintains a dedicated dividend distribution strategy. As there have been no recent cuts or suspensions, the sustainability of these payments seems robust.
| Sector | Dividend Yield | Current Dividend Per Share | Dividend History | Last Cut or Suspension |
|---|---|---|---|---|
| Water Technology | 1.27% | 1.61 USD | 16 years | None |
🗣️ Dividend History
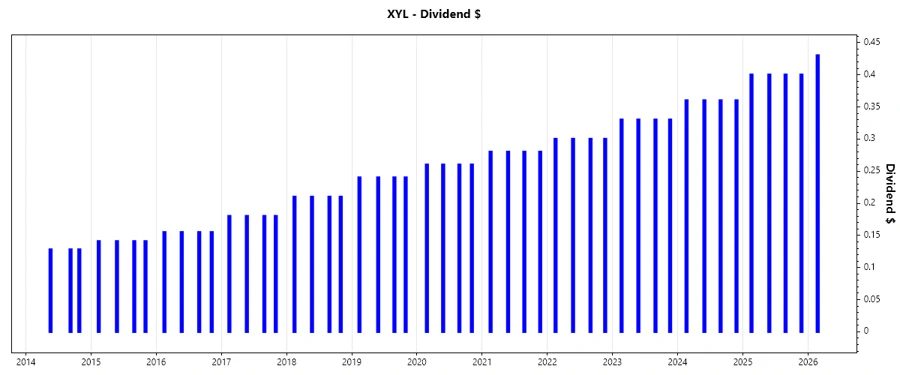
The significance of Xylem's dividend history lies in its proven track record of stability. A consistent history is not only indicative of strong financial health but also boosts investor confidence. Over the past 16 years, Xylem's dividends have shown gradual growth, reflecting sustainable cash flows and prudent management strategies.
| Year | Dividend Per Share (USD) |
|---|---|
| 2026 | 0.43 |
| 2025 | 1.6 |
| 2024 | 1.44 |
| 2023 | 1.32 |
| 2022 | 1.2 |
📈 Dividend Growth
Xylem’s dividend growth rate of 10.06% over the past 3 years and 8.99% over the past 5 years highlights its commitment to enhancing shareholder value through regular increases. This level of growth indicates a steady dividend policy supported by sound operational performance.
| Time | Growth |
|---|---|
| 3 years | 10.06% |
| 5 years | 8.99% |
The average dividend growth is 8.99% over 5 years. This shows moderate but steady dividend growth, aligning with the company’s sustainable payout strategy and reflecting positively on its cash flow generation abilities.
⚠️ Payout Ratio
Assessing Xylem's payout ratios is critical to understanding its dividend sustainability. With an EPS-based payout ratio of 40.86% and a free cash flow-based payout ratio of 42.98%, the payments appear well-covered by earnings and cash flows, suggesting that they remain manageable and sustainable under current conditions.
| Key Figure | Ratio |
|---|---|
| EPS-based | 40.86% |
| Free cash flow-based | 42.98% |
Xylem’s payout ratios demonstrate a healthy balance between rewarding shareholders and retaining earnings for growth initiatives, suggesting stability in its dividend policies.
✅ Cashflow & Capital Efficiency
Cash flow metrics underscore the company’s financial health and its ability to invest in growth. A free cash flow yield of 3.04% and an earnings yield of 3.19% reflect efficient capital allocation and underscore its capacity to maintain dividend payments.
| Metric | 2023 | 2024 | 2025 |
|---|---|---|---|
| Free Cash Flow Yield | 2.28% | 3.35% | 2.75% |
| Earnings Yield | 2.45% | 3.16% | 2.89% |
| CAPEX to Operating Cash Flow | 32.38% | 25.42% | 26.67% |
| Stock-based Compensation to Revenue | 0.81% | 0.65% | 0.59% |
| Free Cash Flow/Operating Cash Flow Ratio | 67.62% | 74.58% | 73.33% |
Xylem exhibits sound financial management through efficient use of its operational cash flow and limited reliance on external financing, highlighting strong capital efficiency.
⚖️ Balance Sheet & Leverage Analysis
The balance sheet provides insight into Xylem’s financial resilience. With a debt-to-equity ratio of 0.17 and a current ratio of 1.62, the figures reflect a well-managed balance sheet with effective debt control and decent liquidity levels.
| Metric | 2023 | 2024 | 2025 |
|---|---|---|---|
| Debt-to-Equity | 0.235 | 0.199 | 0.169 |
| Debt-to-Assets | 0.148 | 0.129 | 0.110 |
| Debt-to-Capital | 0.190 | 0.166 | 0.145 |
| Net Debt to EBITDA | 1.224 | 0.593 | 0.260 |
| Current Ratio | 1.76 | 1.75 | 1.63 |
| Quick Ratio | 1.30 | 1.33 | 1.28 |
| Financial Leverage | 1.58 | 1.55 | 1.54 |
Xylem's prudent management of its leverage indicates solid financial stability, with strong liquidity to meet its short-term liabilities effectively.
💪 Fundamental Strength & Profitability
Xylem's profitability ratios reflect its competitive edge and efficient management, with a return on equity of approximately 8.6% and a net margin consistently above 10%. These metrics highlight the potential for sustained profitability and strong shareholder returns.
| Metric | 2023 | 2024 | 2025 |
|---|---|---|---|
| Return on Equity | 5.99% | 8.36% | 8.34% |
| Return on Assets | 3.78% | 5.40% | 5.43% |
| Net Margin | 8.27% | 10.39% | 10.59% |
| EBIT Margin | 9.29% | 13.21% | 13.39% |
| EBITDA Margin | 15.21% | 19.77% | 19.76% |
| Gross Margin | 36.90% | 37.51% | 38.46% |
| Research & Development to Revenue | 3.15% | 2.69% | 2.50% |
These figures demonstrate Xylem’s robust operational performance and strategic investment in innovation, emphasizing its ability to generate sustained profit and growth.
📉 Price Development
🏆 Dividend Scoring System
| Criteria | Score | Visualization |
|---|---|---|
| Dividend yield | 3/5 | |
| Dividend Stability | 5/5 | |
| Dividend growth | 4/5 | |
| Payout ratio | 4/5 | |
| Financial stability | 5/5 | |
| Dividend continuity | 5/5 | |
| Cashflow Coverage | 4/5 | |
| Balance Sheet Quality | 5/5 |
Total Score: 35/40
🏅 Rating
Xylem Inc. exhibits strong dividend fundamentals with consistent histories in both payouts and growth, alongside a robust balance sheet and cash flow generation capabilities. With a total score of 35 out of 40, Xylem Inc. is recommended for those seeking a reliable dividend investment with moderate growth potential in the water technology sector.
Smart Data Insight
Master the Perfect Entry & Exit for this Stock
Don't leave your profits to chance. Historically, this stock follows specific seasonal patterns that institutional traders use to maximize returns.
- ✅ Identify the "Golden Buying Window"
- ✅ Avoid high-risk correction cycles
- ✅ Backtested data from the last 20+ years