March 03, 2026 a 12:47 pm
XYL: Dividend Analysis - Xylem Inc.
Xylem Inc. demonstrates a consistent approach to dividend distribution with a notable 16-year history. Despite its modest dividend yield of 1.27%, the stable payout and consistent growth are appealing aspects for investors seeking steady income over long-term capital appreciation. The commendable payout ratio and strategic financial management reinforce confidence in Xylem’s ongoing ability to sustain and increase dividends.
Overview 📊
Analyzing Xylem Inc.'s current dividend profile reveals a company deeply committed to shareholder returns through steady dividend provision, despite a relatively low yield.
| Item | Details |
|---|---|
| Sector | Water Technology |
| Dividend yield | 1.27% |
| Current dividend per share | $1.61 |
| Dividend history | 16 years |
| Last cut or suspension | None |
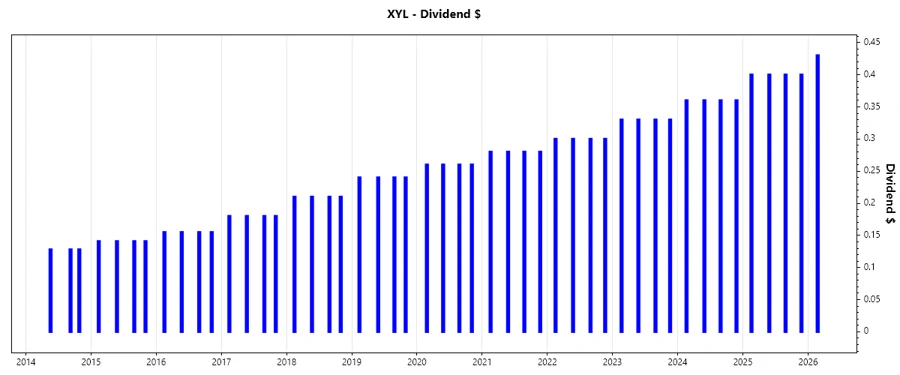
Dividend History 🗓️
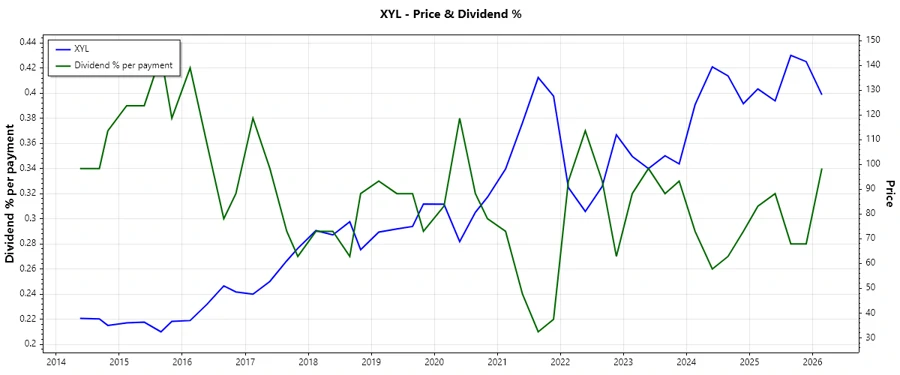
Examining Xylem's dividend history underscores its commitment to steady shareholder returns. A consistent increment over 16 years builds a strong case for reliability in dividend growth.
| Year | Dividend Per Share (USD) |
|---|---|
| 2026 | 0.43 |
| 2025 | 1.60 |
| 2024 | 1.44 |
| 2023 | 1.32 |
| 2022 | 1.20 |
Dividend Growth 📈
Xylem's recent dividend growth rate reflects a strategic commitment to enhancing shareholder value, with a three-year growth of 10.06% and a five-year growth of 8.99%.
| Time | Growth |
|---|---|
| 3 years | 10.06% |
| 5 years | 8.99% |
The average dividend growth is 8.99% over 5 years, showing moderate but steady dividend growth.
Payout Ratio ⚖️
The payout ratio is a crucial metric that evaluates the proportion of earnings paid to shareholders via dividends.
| Key figure | Ratio |
|---|---|
| EPS-based | 40.86% |
| Free cash flow-based | 43.00% |
Xylem's EPS payout ratio of 40.86% and FCF payout ratio of 43.00% suggest a balanced dividend strategy, ensuring sufficient capital for reinvestment while rewarding shareholders.
Cashflow & Capital Efficiency 💰
Assessing cash flow stability and capital efficiency through key metrics highlights Xylem's strategic allocation of resources and operational efficiency, enhancing investor confidence.
| Year | 2023 | 2024 | 2025 |
|---|---|---|---|
| Free Cash Flow Yield | 2.28% | 3.35% | 2.75% |
| Earnings Yield | 2.45% | 3.16% | 2.89% |
| CAPEX to Operating Cash Flow | 32.38% | 25.42% | 26.67% |
| Stock-based Compensation to Revenue | 0.81% | 0.65% | 0.59% |
| Free Cash Flow / Operating Cash Flow Ratio | 67.62% | 74.58% | 73.33% |
Xylem’s strong free cash flow and strategic capital expenditures affirm its ability to generate consistent returns and cover capital costs efficiently.
Balance Sheet & Leverage Analysis 📊
Balance sheet and leverage metrics provide insight into Xylem’s liquidity, debt management, and overall financial robustness, crucial for maintaining sustainable growth.
| Year | 2023 | 2024 | 2025 |
|---|---|---|---|
| Debt-to-Equity | 0.24 | 0.20 | 0.17 |
| Debt-to-Assets | 0.15 | 0.13 | 0.11 |
| Debt-to-Capital | 0.19 | 0.17 | 0.14 |
| Net Debt to EBITDA | 1.22 | 0.59 | 0.26 |
| Current Ratio | 1.76 | 1.75 | 1.63 |
| Quick Ratio | 1.30 | 1.33 | 1.28 |
| Financial Leverage | 1.58 | 1.55 | 1.54 |
Xylem's reduced debt ratios and strong liquidity ratios suggest robust financial flexibility and prudent fiscal management, supporting its growth strategies.
Fundamental Strength & Profitability 📈
Analyzing Xylem's profitability and operational efficiency metrics reveals its robust financial health and ability to generate sustainable returns.
| Year | 2023 | 2024 | 2025 |
|---|---|---|---|
| Return on Equity | 5.99% | 8.36% | 8.34% |
| Return on Assets | 3.78% | 5.40% | 5.43% |
| Margins: Net | 8.27% | 10.39% | 10.59% |
| EBIT | 9.29% | 13.21% | 13.39% |
| EBITDA | 15.21% | 19.77% | 19.75% |
| Gross | 36.90% | 37.51% | 38.46% |
| R&D to Revenue | 3.15% | 2.69% | 2.50% |
Xylem’s impressive return metrics across years display effective resource utilization, while stable margins indicate sound operational control.
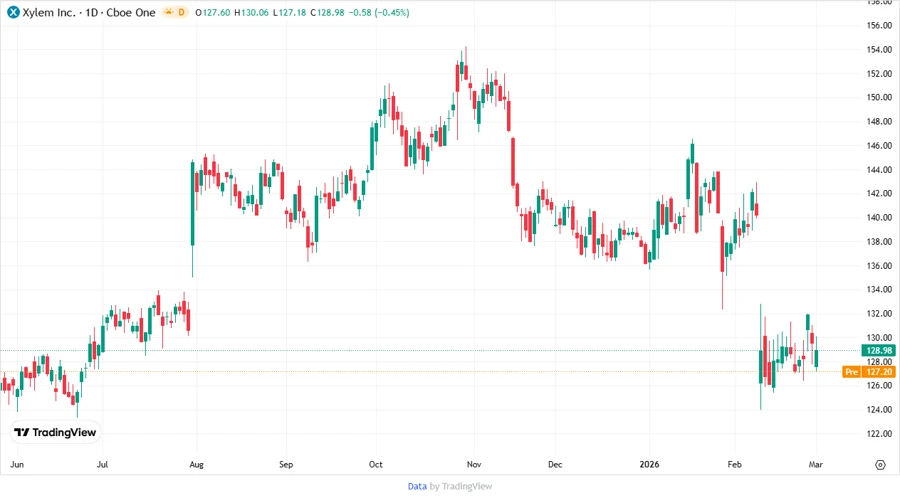
Price Development 📉
Dividend Scoring System ✅
| Category | Score | Relative Bar |
|---|---|---|
| Dividend Yield | 2 | |
| Dividend Stability | 4 | |
| Dividend Growth | 3 | |
| Payout Ratio | 4 | |
| Financial Stability | 4 | |
| Dividend Continuity | 5 | |
| Cashflow Coverage | 4 | |
| Balance Sheet Quality | 5 |
Overall Score: 31/40
Rating 🏆
Based on the comprehensive dividend analysis, Xylem Inc. presents itself as a stable investment for dividend-oriented portfolios, particularly appealing for those prioritizing regular income and financial stability. The company’s prudent financial strategy and incremental dividend growth provide an optimistic outlook for long-term investors.
Smart Data Insight
Master the Perfect Entry & Exit for this Stock
Don't leave your profits to chance. Historically, this stock follows specific seasonal patterns that institutional traders use to maximize returns.
- ✅ Identify the "Golden Buying Window"
- ✅ Avoid high-risk correction cycles
- ✅ Backtested data from the last 20+ years