August 03, 2025 a 07:47 am


XYL: Dividend Analysis - Xylem Inc.
Xylem Inc. presents a moderate dividend yield, indicative of its strategic approach towards steady shareholder returns. With consistent dividend payments over 15 years and a recent growth trend in its dividend distribution, Xylem Inc. showcases its commitment to rewarding its investors. While the current yield is modest, the company's financial prudence and earnings stability provide a solid foundation for sustained future payouts.
Overview 📊
With a focus on the water technology industry, Xylem Inc. has strategically positioned itself in a critical sector. The company's current dividend yield of 1.21% reflects its steady payout policy. A consistent dividend history over 15 years, unmarked by any recent cuts or suspensions, underscores financial resilience.
| Metric | Details |
|---|---|
| Sector | Industrial |
| Dividend yield | 1.21% |
| Current dividend per share | 1.44 USD |
| Dividend history | 15 years |
| Last cut or suspension | None |
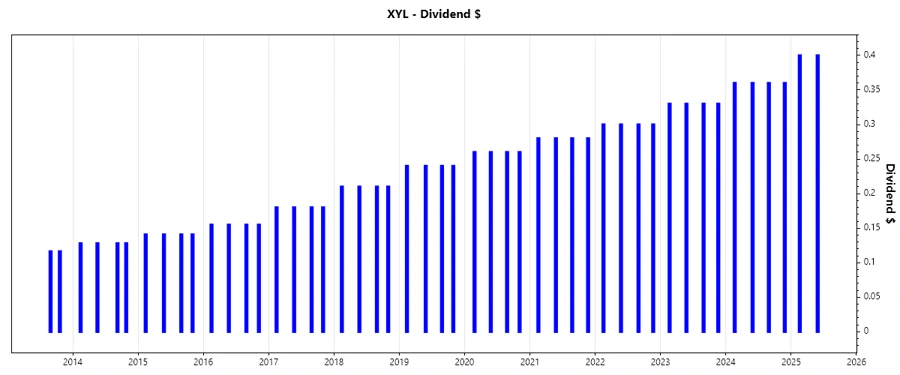
Dividend History 📉
Xylem Inc.'s dividend history is a testament to its commitment to shareholders, with payouts consistently increasing over the years. This trend showcases both stability and growth potential in shareholder returns.
| Year | Dividend per Share (USD) |
|---|---|
| 2025 | 0.8 |
| 2024 | 1.44 |
| 2023 | 1.32 |
| 2022 | 1.2 |
| 2021 | 1.12 |
Dividend Growth 📈
The consistent growth in dividends is a critical indicator of company health and its commitment to increasing shareholder value. Xylem's dividend growth rates over the past 3 and 5 years are noteworthy.
| Time | Growth |
|---|---|
| 3 years | 8.74% |
| 5 years | 8.45% |
The average dividend growth is 8.45% over 5 years. This shows moderate but steady dividend growth.
Payout Ratio ✅
Xylem's payout ratios provide insight into its capacity to sustain its dividend payments. A lower payout ratio suggests the safety of dividends even if earnings fluctuate.
| Key figure | Ratio |
|---|---|
| EPS-based | 37.44% |
| Free cash flow-based | 39.87% |
With payout ratios of 37.44% (EPS) and 39.87% (FCF), Xylem maintains a robust cushion, ensuring dividend safety and potential for further growth even during challenging economic climates.
Cashflow & Capital Efficiency ⚙️
In evaluating cash flow stability and capital efficiency, Xylem demonstrates strong operational capabilities, reflected in its fiscal metrics.
| Year | 2024 | 2023 | 2022 |
|---|---|---|---|
| Free Cash Flow Yield | 3.35% | 2.28% | 1.95% |
| Earnings Yield | 3.16% | 2.45% | 1.78% |
| CAPEX to Operating Cash Flow | 25.41% | 32.37% | 34.90% |
| Stock-based Compensation to Revenue | 0.65% | 0.81% | 0.67% |
| Free Cash Flow / Operating Cash Flow Ratio | 74.58% | 67.62% | 65.10% |
The cash flow ratios suggest efficient capital use with consistent free cash flow generation, supporting both operational needs and shareholder returns.
Balance Sheet & Leverage Analysis ⚖️
Analyzing Xylem's balance sheet gives insight into its financial stability and leverage. The ratios indicate sound financial management.
| Year | 2024 | 2023 | 2022 |
|---|---|---|---|
| Debt-to-Equity | 0.19 | 0.23 | 0.63 |
| Debt-to-Assets | 0.12 | 0.15 | 0.28 |
| Debt-to-Capital | 0.16 | 0.19 | 0.39 |
| Net Debt to EBITDA | 0.53 | 1.22 | 1.73 |
| Current Ratio | 1.90 | 1.76 | 1.89 |
| Quick Ratio | 1.33 | 1.30 | 1.39 |
| Financial Leverage | 1.55 | 1.58 | 2.28 |
The solid debt ratios and strong liquidity position suggest low financial risk and ample capacity to leverage future growth opportunities.
Fundamental Strength & Profitability ⚒️
Assessing the core profitability metrics provides key insights into operational efficiency and competitive positioning.
| Year | 2024 | 2023 | 2022 |
|---|---|---|---|
| Return on Equity | 8.36% | 5.99% | 10.16% |
| Return on Assets | 5.39% | 3.78% | 4.46% |
| Margins: Net | 10.39% | 8.27% | 6.43% |
| EBIT | 13.21% | 9.29% | 8.87% |
| EBITDA | 19.77% | 15.21% | 13.15% |
| Gross | 37.51% | 36.90% | 37.74% |
| Research & Development to Revenue | 2.69% | 3.15% | 3.73% |
Strong profitability metrics suggest Xylem's efficiency in operations and solid gross margins position it well for future profitability growth despite competitive pressures.
Price Development 📈
Dividend Scoring System 🗳️
| Criterion | Score | Bar |
|---|---|---|
| Dividend yield | 3 | |
| Dividend Stability | 4 | |
| Dividend growth | 4 | |
| Payout ratio | 4 | |
| Financial stability | 5 | |
| Dividend continuity | 5 | |
| Cashflow Coverage | 4 | |
| Balance Sheet Quality | 5 |
Overall Score: 34/40
Rating 🏆
In summary, Xylem Inc. offers a robust dividend profile with steady growth potential. Its strong financial stability and effective capital reallocation strategies make it a reliable choice for dividend-seeking investors. Prudent management practices underscore a favorable investment outlook.
Smart Data Insight
Master the Perfect Entry & Exit for this Stock
Don't leave your profits to chance. Historically, this stock follows specific seasonal patterns that institutional traders use to maximize returns.
- ✅ Identify the "Golden Buying Window"
- ✅ Avoid high-risk correction cycles
- ✅ Backtested data from the last 20+ years