October 15, 2025 a 05:15 am

XOM: Fibonacci Analysis - Exxon Mobil Corporation
The Exxon Mobil Corporation, a stalwart in the energy sector, is exhibiting strong historical performance with strategic operations spanning upstream, downstream, and chemical activities. Investors are keenly observing its technical indicators for potential entry points. Recently, the stock has portrayed a noticeable trend, which could present new opportunities or warnings for market participants.
Fibonacci Analysis
| Analysis Detail | Information |
|---|---|
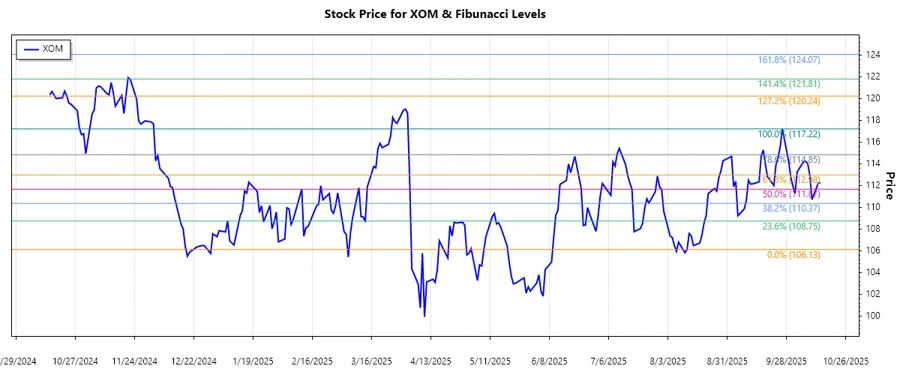
| Trend Period | August 18, 2025 - October 14, 2025 |
| High Point | $117.22 (September 26, 2025) |
| Low Point | $106.13 (August 12, 2025) |
| Fibonacci Levels |
0.236: $108.47 0.382: $110.34 0.5: $111.67 0.618: $113.00 0.786: $114.89 |
| Current Price | $112.29 (October 14, 2025) |
| Current Retracement Zone | 0.5 |
| Interpretation | The current price sits at the 0.5 retracement zone, suggesting potential consolidation or a pivot point, indicating possible support at this level. |
Conclusion
Exxon Mobil's recent trend analysis reveals the stock is in a critical zone, often seen as a psychological mid-point in retracements. This level might serve as a support where the stock can stabilize before a potential upward movement. However, the energy market's inherent volatility should be considered, as fluctuations could challenge support levels. Analysts will closely watch for signs of strength or a breakthrough to anticipate future price movements that leverage technical patterns as supportive evidence for investment strategies.
Smart Data Insight
Master the Perfect Entry & Exit for this Stock
Don't leave your profits to chance. Historically, this stock follows specific seasonal patterns that institutional traders use to maximize returns.
- ✅ Identify the "Golden Buying Window"
- ✅ Avoid high-risk correction cycles
- ✅ Backtested data from the last 20+ years