August 29, 2025 a 05:15 am
XOM: Fibonacci Analysis - Exxon Mobil Corporation
Exxon Mobil Corporation has been a significant player in the global energy sector. The stock has experienced both significant growth and periods of consolidation. As of the last analysis, the stock shows a promising trend influenced by market demands and oil prices. Recently, market conditions have supported a favorable price movement for XOM, making it an interesting candidate for technical analysis.
Fibonacci Analysis
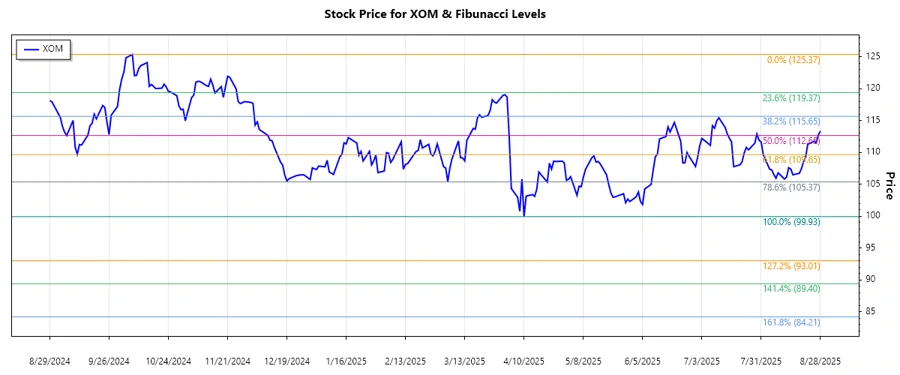
The analysis period indicates a strong downtrend for Exxon Mobil (XOM). The Fibonacci retracement levels are calculated between the high point of $125.37 and the recent low of $99.93.
| Analysis Period | High Price | Low Price |
|---|---|---|
| 2024-10-07 to 2025-08-28 | $125.37 (2024-10-07) | $99.93 (2025-04-10) |
| Fibonacci Level | Price Level |
|---|---|
| 0.236 | $106.49 |
| 0.382 | $110.28 |
| 0.5 | $112.65 |
| 0.618 | $115.02 |
| 0.786 | $119.07 |
The current price of $113.35 suggests that the stock is currently trading between the 0.5 and 0.618 retracement levels, indicating a potential resistance in this area. If the price stays above the 0.5 level, it could be considered a support level. However, should it drop below, it may signal further bearish momentum.
Conclusion
The current trend of Exxon Mobil indicates a cautious outlook for the stock. The retracement levels suggest crucial resistance zones that may impact further price action. Analysts should consider the potential for increased volatility in the energy sector. If geopolitical or supply factors shift, it could provide favorable conditions for XOM to resume its previous highs. However, existing economic constraints might necessitate prudent trading strategies. Continuous monitoring of key price points is recommended to anticipate any sudden market reactions.
Smart Data Insight
Master the Perfect Entry & Exit for this Stock
Don't leave your profits to chance. Historically, this stock follows specific seasonal patterns that institutional traders use to maximize returns.
- ✅ Identify the "Golden Buying Window"
- ✅ Avoid high-risk correction cycles
- ✅ Backtested data from the last 20+ years