February 07, 2026 a 12:47 pm

XOM: Dividend Analysis - Exxon Mobil Corporation
Exxon Mobil Corporation exhibits a resilient dividend profile with notable growth history over decades. Despite a modest current yield, the commitment to sustaining dividends over 57 years is commendable, showcasing the company's stability and investor focus. The absence of recent dividend cuts highlights the firm's fiscal discipline and strategic foresight.
📊 Overview
Exxon Mobil Corporation operates within the Energy sector, offering robust fundamentals reflective of industry resilience and investment appeal.
| Metric | Value |
|---|---|
| Sector | Energy |
| Dividend Yield | 2.71 % |
| Current Dividend Per Share | 0 USD |
| Dividend History | 57 years |
| Last Cut or Suspension | None |
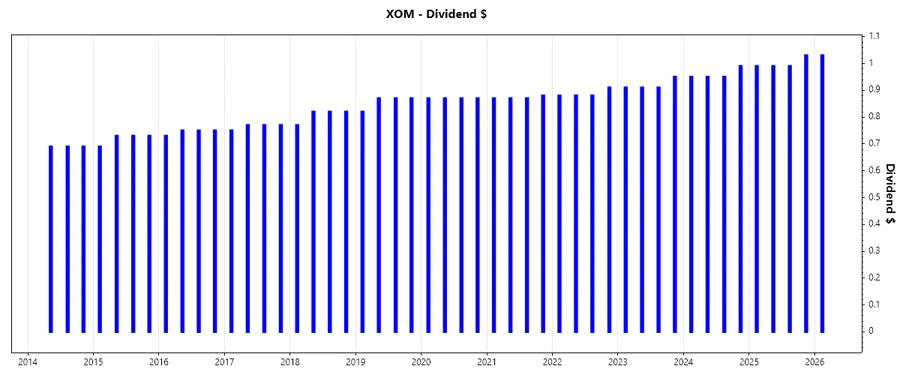
🗣️ Dividend History
With 57 years of continuous payouts, Exxon Mobil underlines its capacity for consistent and predictable dividend delivery. This metric is crucial for evaluating long-term investment security and income reliability.
| Year | Dividend per Share (USD) |
|---|---|
| 2026 | 1.03 |
| 2025 | 4.00 |
| 2024 | 3.84 |
| 2023 | 3.68 |
| 2022 | 3.55 |
📈 Dividend Growth
The growth of dividends directly supports capital appreciation potential and inflation protection. Stability in growth further augments investor confidence.
| Time | Growth |
|---|---|
| 3 years | 4.06 % |
| 5 years | 2.82 % |
The average dividend growth is 2.82 % over 5 years. This shows moderate but steady dividend growth.
✅ Payout Ratio
The payout ratio is a critical indicator of dividend sustainability, showcasing the proportion of earnings and free cash flow utilized for dividend distributions.
| Key figure | Ratio |
|---|---|
| EPS-based | 0 % |
| Free cash flow-based | 0 % |
The EPS payout ratio of 0 % and FCF payout ratio of 0 % suggest potential for future dividend increases, given current fiscal capacity and effective cash management strategies.
📉 Cashflow & Capital Efficiency
Efficiency and cash flow metrics are pivotal for analyzing the ability to cover dividend payments and repurchase shares while investing in growth opportunities.
| Metric | 2025 | 2024 | 2023 |
|---|---|---|---|
| Free Cash Flow Yield | 0 | 6.64% | 8.26% |
| Earnings Yield | 0% | 7.28% | 8.89% |
| CAPEX to Operating Cash Flow | 54.57% | 44.18% | 39.59% |
| Stock-based Compensation to Revenue | 0% | 0% | 0.18% |
| Free Cash Flow / Operating Cash Flow Ratio | 45.43% | 55.82% | 60.41% |
Exxon Mobil displays a robust cash flow generation capability facilitating strategic flexibility. The CAPEX to Operating Cash Flow ratios reflect balanced reinvestment in future growth while ensuring healthy free cash flows.
📊 Balance Sheet & Leverage Analysis
Analyzing leverage provides insights into financial risk and creditworthiness. Optimized debt levels foster financial resilience.
| Metric | 2025 | 2024 | 2023 |
|---|---|---|---|
| Debt-to-Equity | 16.78% | 15.82% | 20.30% |
| Debt-to-Assets | 9.70% | 9.20% | 11.05% |
| Debt-to-Capital | 14.37% | 13.66% | 16.87% |
| Net Debt to EBITDA | 0.88 | 0.25 | 0.14 |
| Current Ratio | 1.15 | 1.31 | 1.48 |
| Quick Ratio | 0.79 | 0.97 | 1.09 |
| Financial Leverage | 1.73 | 1.72 | 1.84 |
The company's leverage ratios indicate a conservatively leveraged balance sheet, enhancing stability and capital allocation acumen. The readily available liquidity facilitates operational efficiency without exacerbating credit exposure.
📈 Fundamental Strength & Profitability
Profitability metrics, including margins and returns, reflect strategic operational effectiveness contributing to sustainable shareholder returns.
| Metric | 2025 | 2024 | 2023 |
|---|---|---|---|
| Return on Equity | 11.12% | 12.77% | 17.58% |
| Return on Assets | 6.42% | 7.43% | 9.57% |
| Return on Invested Capital | 6.34% | 7.33% | 9.99% |
| Net Profit Margin | 8.91% | 9.93% | 10.76% |
| EBIT Margin | 12.93% | 14.70% | 16.02% |
| EBITDA Margin | 20.95% | 21.61% | 22.19% |
| Gross Margin | 21.68% | 22.62% | 25.14% |
| Research & Development to Revenue | 0% | 0.29% | 0.26% |
Exxon Mobil demonstrates strong fundamental metrics enhancing its competitive positioning. Consistent high returns and margins affirm its proficient cost management and strategic resource allocation.
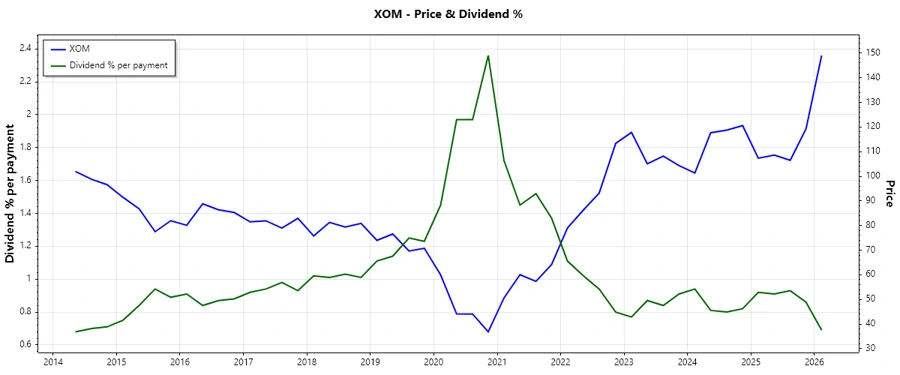
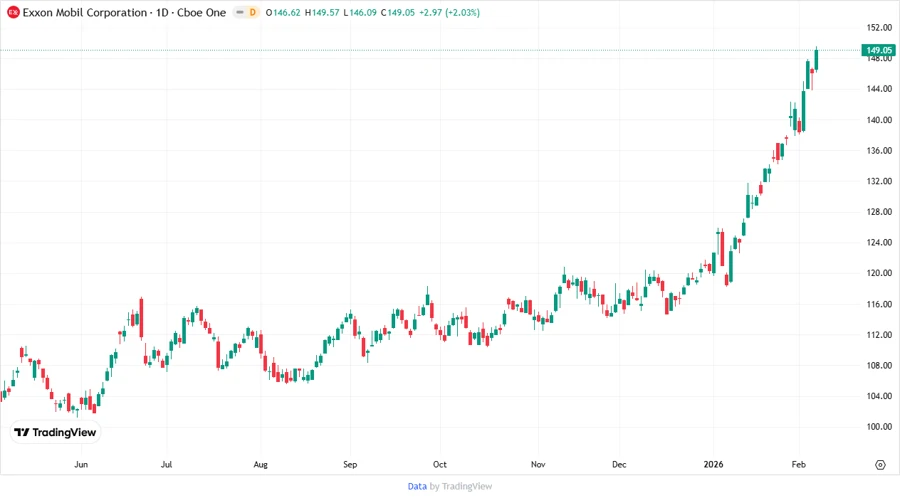
🔍 Price Development
💡 Dividend Scoring System
| Category | Score | |
|---|---|---|
| Dividend Yield | 3 | |
| Dividend Stability | 5 | |
| Dividend Growth | 3 | |
| Payout Ratio | 4 | |
| Financial Stability | 4 | |
| Dividend Continuity | 5 | |
| Cashflow Coverage | 4 | |
| Balance Sheet Quality | 4 |
Total Score: 32/40
🏆 Rating
Exxon Mobil Corporation's current dividend and financial strategies showcase a strong commitment to investor returns. With consistent payout history, manageable debt levels, and healthy cash flow metrics, XOM presents a compelling investment opportunity for long-term growth and income persistence.