February 10, 2026 a 02:03 pm

XEL: Trend and Support & Resistance Analysis - Xcel Energy Inc.
Xcel Energy Inc. has shown resilience with its diversified energy generation resources. The company's extensive electricity and natural gas operations serve over 5 million customers. Recently, the stock exhibits a stabilization phase following a significant correction, indicative of potential recovery opportunities. However, external market pressures could pose challenges.
Trend Analysis
| Date | Close Price | Trend |
|---|---|---|
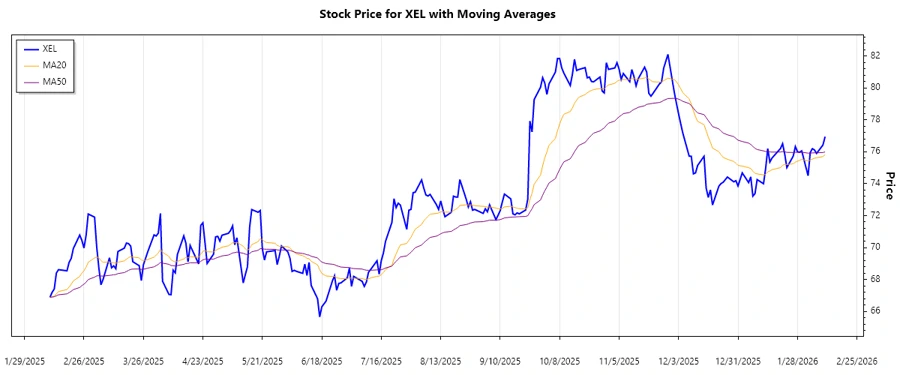
| 2026-02-10 | 76.95 | ▲ |
| 2026-02-09 | 76.43 | ▲ |
| 2026-02-06 | 75.9 | ▲ |
| 2026-02-05 | 76.12 | ▲ |
| 2026-02-04 | 76.2 | ▲ |
| 2026-02-03 | 75.95 | ▲ |
| 2026-02-02 | 74.5 | ▼ |
The current trend displays a positive shift with EMA20 surpassing EMA50, suggesting an upward momentum in the short term.
Support- and Resistance
| Type | Zone From | Zone To |
|---|---|---|
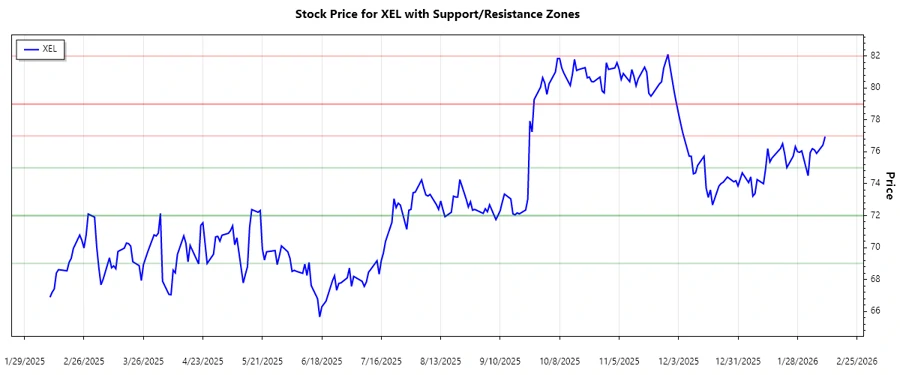
| Resistance | 79.00 | 82.00 |
| Resistance | 77.00 | 79.00 |
| Support | 72.00 | 75.00 |
| Support | 69.00 | 72.00 |
The stock currently trades within the support zone 72.00 - 75.00, indicating consolidation with potential for a bounce.
Conclusion
Xcel Energy Inc.'s stock has experienced a corrective phase and is now entering a stabilizing trend. The recent upward momentum suggests potential recovery, aligned with the generally bullish EMA indicators. However, external influences, such as regulatory changes and energy market dynamics, remain significant risks. The support zones highlight investor interest in this stock, with possible resistance challenges. The technical indicators are promising for those looking to enter or hold positions. Analysts should remain vigilant to market shifts to adapt strategies accordingly.