
July 14, 2026 a 05:15 am
XEL: Fibonacci Analysis - Xcel Energy Inc.
Xcel Energy Inc. has shown a resilient position in the energy market with a diverse range of energy sources, both traditional and renewable. The stock has exhibited a notable trend in recent months, reflecting its operational stability and market adaptability. Recent technical analysis suggests potential strategic entry or exit points for investors based on prevailing trends.
Fibonacci Analysis
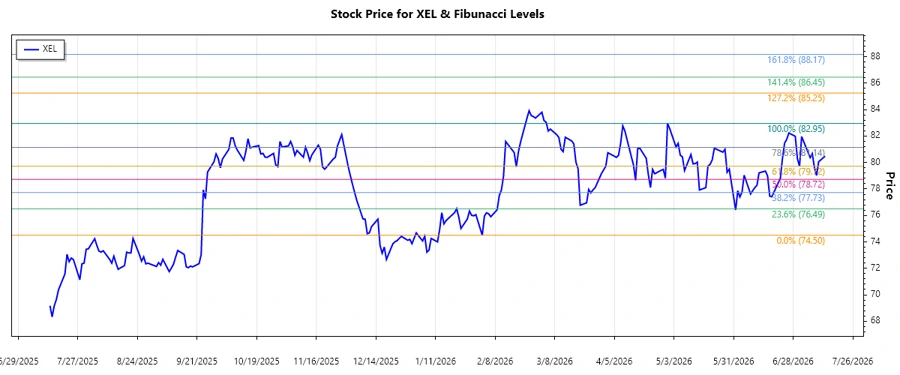
The analysis of Xcel Energy Inc.'s stock for the past several months indicates a dominant upward trend. The starting point of this trend was in early February 2026, with a notable peak occurring in mid-July of the same year. Employing Fibonacci retracement helps us identify potential support and resistance levels that may impact future price movements.
| Start Date | End Date | Low Price (Date) | High Price (Date) | Level | Price |
|---|---|---|---|---|---|
| 2026-02-02 | 2026-07-13 | $74.5 (2026-02-02) | $82.95 (2026-04-30) | 0.236 | $80.91 |
| 0.382 | $79.68 | ||||
| 0.5 | $78.725 | ||||
| 0.618 | $77.77 | ||||
| 0.786 | $76.523 |
As of the latest data, the current price of XEL is $80.48, placing it within the 0.236 and 0.382 retracement zone. This area may act as a minor resistance, suggesting the potential for a price bounce if buyers dominate.
Conclusion
The Fibonacci analysis of Xcel Energy Inc.'s stock suggests that XEL is currently in a retracement zone, which could provide potential support and resistance levels. Analysts might view the proximity to the 0.236 level as a signal for careful monitoring, as it could dictate a point of resistance or enable further upward movement. Investors are encouraged to consider external market factors, such as regulatory changes or shifts in energy demand, which may affect Xcel's strategic endeavors and therefore impact its stock performance. While the company's leadership in renewable energy presents long-term growth potential, the volatility of the energy market necessitates cautious investment strategies.
Smart Data Insight
Master the Perfect Entry & Exit for this Stock
Don't leave your profits to chance. Historically, this stock follows specific seasonal patterns that institutional traders use to maximize returns.
- ✅ Identify the "Golden Buying Window"
- ✅ Avoid high-risk correction cycles
- ✅ Backtested data from the last 20+ years