January 30, 2026 a 12:46 pm


XEL: Dividend Analysis - Xcel Energy Inc.
Xcel Energy Inc. is a significant player in the energy sector with a strong dividend history. Despite challenges, the company has shown stable financial and operational performance. The company's dividend yield and growth exhibit promise, although recent headwinds have impacted their historical consistency.
📊 Overview
Xcel Energy operates within a robust sector with competitive dividend offerings. The company's strong dividend history indicates reliability, though recent disruptions marked by the last cut or suspension in 2024 may caution some investors.
| Metric | Value |
|---|---|
| Sector | Energy |
| Dividend yield | 3.08% |
| Current dividend per share | 2.09 USD |
| Dividend history | 42 years |
| Last cut or suspension | 2024 |
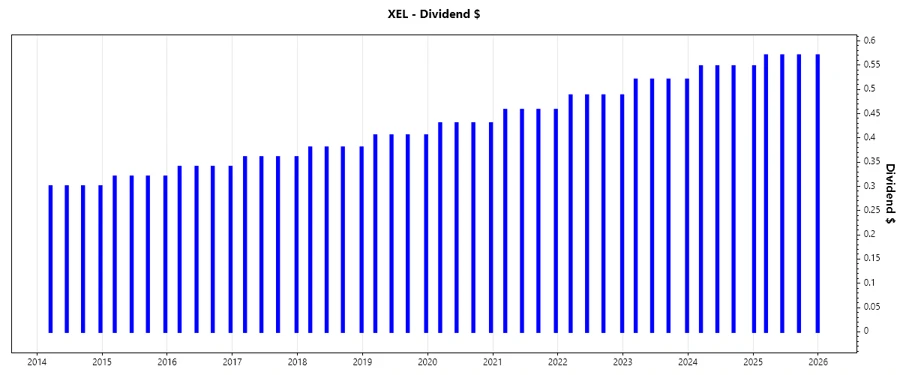
🗣️ Dividend History
The strong historical dividend payments from Xcel Energy emphasize its commitment to returning capital to shareholders. However, it's crucial to analyze the recent patterns considering the cut in 2024, which signifies potential shifting strategies or external market challenges.
| Year | Dividend per Share |
|---|---|
| 2025 | 2.8275 USD |
| 2024 | 1.6425 USD |
| 2023 | 2.08 USD |
| 2022 | 1.9500 USD |
| 2021 | 1.8300 USD |
📈 Dividend Growth
The steady growth in dividends is a key reflection of Xcel Energy's strategic financial health aimed at incrementally enhancing shareholder value. However, the below-average growth compared to peers indicates the need for strategic reevaluation.
| Time | Growth |
|---|---|
| 3 years | 13.19% |
| 5 years | 10.45% |
The average dividend growth is 10.45% over 5 years. This shows moderate but steady dividend growth.
⚠️ Payout Ratio
Xcel Energy's payout ratios provide insight into its dividend sustainability. Analyzing the EPS and FCF figures helps gauge potential for future dividend increases and financial flexibility under current cash flow circumstances.
| Key figure | Ratio |
|---|---|
| EPS-based | 63.21% |
| Free cash flow-based | -54.39% |
The EPS-based payout ratio of 63.21% suggests a reasonable level of dividend coverage from earnings. However, the negative FCF payout indicates potential liquidity challenges, compromising future growth potential.
💡 Cashflow & Capital Efficiency
Exploring the cash flows reveals the company's operational and financial flexibility. Robust free cash flow yields and efficient capital allocation underwrite the potential for reinvestment opportunities and shock absorption capacity.
| Metric | 2024 | 2023 | 2022 |
|---|---|---|---|
| Free Cash Flow Yield | -7.16% | -1.54% | -1.84% |
| Earnings Yield | 5.09% | 5.18% | 4.53% |
| CAPEX to Operating Cash Flow | 158.67% | 109.89% | 117.95% |
| Stock-based Compensation to Revenue | 0.31% | 0.18% | 0.13% |
| Free Cash Flow / Operating Cash Flow Ratio | -58.67% | -9.89% | -17.95% |
Cash flow stability reflects the company's operational robustness; however, a negative free cash flow yield and fluctuating CAPEX ratios underscore potential liquidity management vulnerabilities.
📊 Balance Sheet & Leverage Analysis
The balance sheet analysis unveils the corporation's financial posture, deciphering leverage and debt structures to evaluate overall fiscal strength and operational safety.
| Metric | 2024 | 2023 | 2022 |
|---|---|---|---|
| Debt-to-Equity | 1.55 | 1.56 | 1.56 |
| Debt-to-Assets | 43.13% | 42.94% | 42.54% |
| Debt-to-Capital | 60.74% | 60.97% | 60.95% |
| Net Debt to EBITDA | 5.37 | 5.27 | 5.10 |
| Current Ratio | 0.67 | 0.72 | 0.85 |
| Quick Ratio | 0.57 | 0.59 | 0.71 |
| Financial Leverage | 3.59 | 3.64 | 3.67 |
The corporation's financial leverage ratios and moderate debt-to-equity ratios emphasize solid fiscal management, despite potential liquidity risks highlighted by the quick ratio trends.
🔍 Fundamental Strength & Profitability
Xcel Energy's profitability metrics underscore its ability to generate earnings robustly. Returns on equity and asset management capabilities furnish insights into efficiency and operational success.
| Metric | 2024 | 2023 | 2022 |
|---|---|---|---|
| Return on Equity | 9.92% | 10.05% | 10.41% |
| Return on Assets | 2.76% | 2.76% | 2.84% |
| Net Margin | 14.40% | 12.47% | 11.34% |
| EBIT Margin | 20.21% | 18.51% | 16.50% |
| EBITDA Margin | 41.60% | 36.58% | 33.18% |
| Gross Margin | 45.74% | 42.09% | 38.28% |
| Research & Development to Revenue | 0.00% | 0.00% | 0.00% |
Profitability remains robust with improving margins, even though the absence of R&D spending might indicate potential challenges in maintaining innovation-driven competitive advantages.
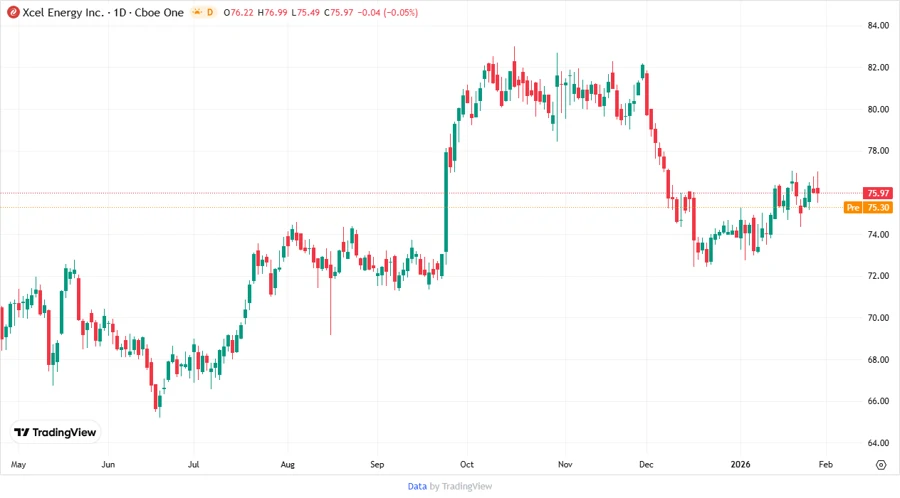
📉 Price Development
✅ Dividend Scoring System
| Category | Score | |
|---|---|---|
| Dividend yield | 3 | |
| Dividend Stability | 4 | |
| Dividend growth | 3 | |
| Payout ratio | 3 | |
| Financial stability | 4 | |
| Dividend continuity | 4 | |
| Cashflow Coverage | 2 | |
| Balance Sheet Quality | 3 |
Total Score: 26/40
📈 Rating
In conclusion, Xcel Energy Inc. presents a reliable yet cautiously optimistic opportunity for dividend-focused investors. The overall score of 26/40 suggests areas for strategic enhancements, particularly in cash flow management, while maintaining solid financial health and dividend consistency. Investors should weigh the robustness of current financial metrics against potential industry challenges.