December 26, 2025 a 07:31 am


XEL: Dividend Analysis - Xcel Energy Inc.
Xcel Energy Inc. presents a substantial dividend profile. Despite a recent last cut or suspension in 2024, the company boasts a long dividend history of 42 years, which generally signifies reliability to investors. However, potential investors should carefully examine factors like payout ratios, which exhibit strains, as highlighted by a negative Free Cash Flow payout ratio.
Overview 📊
The explicit dividend metrics provide insight into the health and attractiveness of Xcel Energy Inc. within its sector. The sector-related data, combined with yield metrics, reveal the company’s strategy amidst broader industry trends.
| Metric | Value |
|---|---|
| Sector | Utilities |
| Dividend yield | 3.077% |
| Current dividend per share | $2.09 USD |
| Dividend history | 42 years |
| Last cut or suspension | 2024 |
Dividend History 🗣️
A continuous dividend history is pivotal, serving as a testament to a company's commitment to return value to shareholders. Such a record aids in building investor trust.
| Year | Dividend per Share (USD) |
|---|---|
| 2025 | 2.8275 |
| 2024 | 1.6425 |
| 2023 | 2.08 |
| 2022 | 1.95 |
| 2021 | 1.83 |
Dividend Growth 📈
Growth in dividends reflects the company's capacity to increase value return to its shareholders, signifying financial strength.
| Time | Growth |
|---|---|
| 3 years | -0.035% |
| 5 years | 0.0027% |
The average dividend growth is 0.0027% over 5 years. This shows moderate but steady dividend growth.
Payout Ratio 📉
Understanding payout ratios is critical as they exhibit a company’s ability to sustain dividends. A high payout ratio may suggest limited room for flexibility in adverse financial climates.
| Key figure | Ratio |
|---|---|
| EPS-based | 86.52% |
| Free cash flow-based | -125.95% |
An EPS payout ratio of 86.52% is relatively high, suggesting profitability challenges, whereas a negative FCF payout raises concerns about liquidity and financial health.
Cashflow & Capital Efficiency ✅
Examining FCF and capital efficiency gauges a company’s ability to reinvest and sustain dividend payments without compromising growth.
| Metric | 2024 | 2023 | 2022 |
|---|---|---|---|
| Free Cash Flow Yield | -7.16% | -1.54% | -1.84% |
| Earnings Yield | 5.09% | 5.18% | 4.53% |
| CAPEX to Operating Cash Flow | 1.59 | 1.10 | 1.18 |
| Stock-based Compensation to Revenue | 0.25% | 0.18% | 0.13% |
| Free Cash Flow / Operating Cash Flow Ratio | -0.59 | -0.10 | -0.18 |
The negative FCF yield signals cash flow challenges affecting capital efficiency and the firm’s capability to sustain dividends.
Balance Sheet & Leverage Analysis ⚠️
Balance sheet strength, leverage, and cash position highlight growth potential and financial risks.
| Metric | 2024 | 2023 | 2022 |
|---|---|---|---|
| Debt-to-Equity | 1.55 | 1.56 | 1.56 |
| Debt-to-Assets | 0.43 | 0.43 | 0.43 |
| Debt-to-Capital | 0.61 | 0.61 | 0.61 |
| Net Debt to EBITDA | 15.82 | 5.27 | 5.10 |
| Current Ratio | 0.79 | 0.72 | 0.85 |
| Quick Ratio | 0.57 | 0.59 | 0.71 |
| Financial Leverage | 3.59 | 3.64 | 3.67 |
A high leverage indicates a significant portion of debt powering growth, adding financial risk.
Fundamental Strength & Profitability 🧩
Profitability, as reflected in margins and return metrics, is essential for earnings power and long-term growth.
| Metric | 2024 | 2023 | 2022 |
|---|---|---|---|
| Return on Equity | 9.92% | 10.05% | 10.41% |
| Return on Assets | 2.76% | 2.76% | 2.84% |
| Return on Invested Capital | 4.59% | 4.51% | 4.60% |
| Net Margin | 14.40% | 12.47% | 11.34% |
| EBIT Margin | 20.21% | 18.51% | 16.50% |
| EBITDA Margin | 41.60% | 36.58% | 33.18% |
| Gross Margin | 45.74% | 42.09% | 38.28% |
| Research & Development to Revenue | 0.00% | 0.00% | 0.00% |
The steady profitability ratios affirm an enviable ability to moderately sustain shareholder value, barring cash flow impediments.
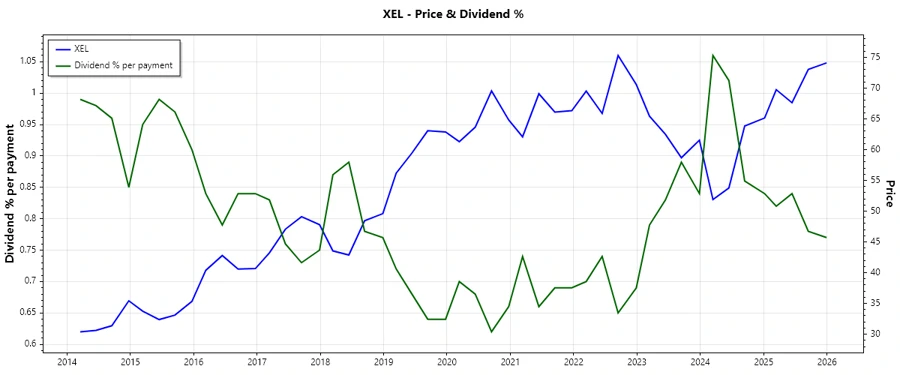
Price Development
Dividend Scoring System 🎯
| Category | Description | Score |
|---|---|---|
| Dividend yield | Relative return on stock purchase | 3 |
| Dividend Stability | Consistency of dividend payouts over time | 4 |
| Dividend Growth | Increase in dividend payments over time | 2 |
| Payout ratio | Share of earnings paid as dividends | 2 |
| Financial stability | Soundness of financial health and growth prospects | 3 |
| Dividend continuity | Uninterrupted history of dividend payments | 4 |
| Cashflow Coverage | Extent of cash flow adequacy to cover dividends | 1 |
| Balance Sheet Quality | Financial structure and risk underpinning the company | 3 |
Total Score: 22/40
Rating ⭐
In summary, Xcel Energy Inc. demonstrates a respectable track record in dividend distribution, bolstered by a stable dividend history and moderate financial health. However, concerns around cash flow and high payout ratios necessitate a cautious investment approach. Investors should weigh these elements before integrating XEL into their portfolios.