November 08, 2025 a 12:46 pm
XEL: Dividend Analysis - Xcel Energy Inc.
📈 Xcel Energy Inc. has a solid foundation with a long history of dividend payments, which is crucial for income-focused investors. However, recent years have seen challenges, with the last dividend cut occurring in 2024, indicating a need for careful evaluation. The company's dividend yield of 3.09% is attractive, yet the payout ratios signal potential concerns for sustainability.
Overview
Xcel Energy Inc. operates in a sector that benefits from stable revenue streams, making its dividend policy notable. The dividend yield stands at 3.09%, with the current dividend per share at 2.09 USD. With a history of 42 consecutive years of dividend payout, the company stands strong. However, a recent dividend cut in 2024 warrants close monitoring.
| Parameter | Value |
|---|---|
| Sector | Utilities |
| Dividend yield | 3.09% |
| Current dividend per share | 2.09 USD |
| Dividend history | 42 years |
| Last cut or suspension | 2024 |
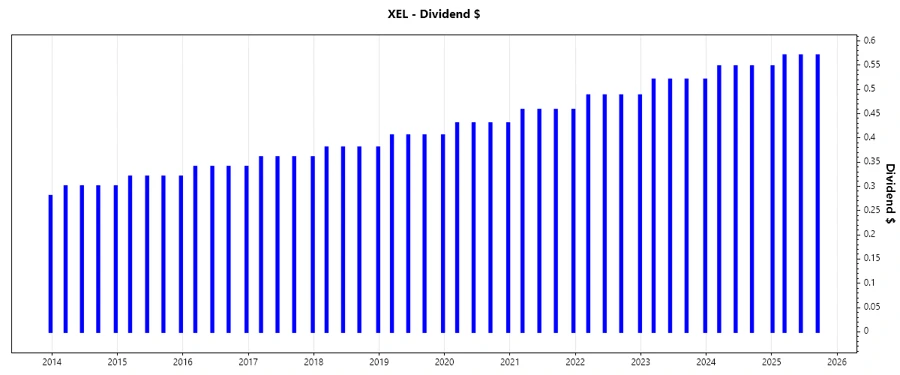
Dividend History
The stability of Xcel Energy's dividend payout over 42 years highlights its commitment to returning value to shareholders. A track record of consistent dividends reassures investors about future income. However, the recent dividend cut imposes the need for vigilance regarding potential fiscal challenges facing the company.
| Year | Dividend per Share (USD) |
|---|---|
| 2025 | 2.2575 |
| 2024 | 1.6425 |
| 2023 | 2.08 |
| 2022 | 1.9500 |
| 2021 | 1.8300 |
Dividend Growth
The dividend growth over a three-year period is minimal, reflecting challenges faced by the company. Growth over five years remains flat, underscoring a period of stagnation. This lack of significant growth demands strategic realignment to ensure long-term shareholder value and income reliability.
| Time | Growth |
|---|---|
| 3 years | -0.035% |
| 5 years | 0.0028% |
✅ The average dividend growth is 0.0028% over 5 years. This shows moderate but steady dividend growth, albeit requiring improvement to attract growth-oriented investors.
Payout Ratio
Payout ratios provide insights into the dividend sustainability of a company. Xcel Energy's EPS-based payout ratio is high, at 86.52%, indicating limited room for paying dividends from earnings. Simultaneously, the negative FCF payout ratio suggests unsustainable cashflow being used for dividends, underlying the importance of monitoring financial health closely.
| Key Figure | Ratio |
|---|---|
| EPS-based | 86.52% |
| Free cash flow-based | -125.95% |
⚠️ The high EPS payout ratio and negative FCF ratio indicate potential stresses on the company's ability to maintain current dividend levels without affecting overall financial health.
Cashflow & Capital Efficiency
Sustainable dividend payouts are reliant on robust cashflow management. Despite challenges, Xcel Energy Inc.'s efficiency metrics reveal opportunities for optimization.
| Metric | 2024 | 2023 | 2022 |
|---|---|---|---|
| Free Cash Flow Yield | -7.16% | -1.54% | -1.84% |
| Earnings Yield | 5.09% | 5.18% | 4.53% |
| CAPEX to Operating Cash Flow | 1.59 | 1.10 | 1.18 |
| Stock-based Compensation to Revenue | 0.24% | 0.18% | 0.13% |
| Free Cash Flow / Operating Cash Flow Ratio | -0.59 | -0.10 | -0.18 |
⚠️ The negative cash flow yield and high CAPEX ratios demonstrate a deficiency in cash utilization, posing risks to dividend sustainability.
Balance Sheet & Leverage Analysis
Understanding leverage and liquidity ratios is essential for assessing financial stability. Xcel Energy's analysis suggests substantial leverage, which could impact operational flexibility.
| Metric | 2024 | 2023 | 2022 |
|---|---|---|---|
| Debt-to-Equity | 1.55 | 1.56 | 1.56 |
| Debt-to-Assets | 0.43 | 0.43 | 0.43 |
| Debt-to-Capital | 0.61 | 0.61 | 0.61 |
| Net Debt to EBITDA | 5.37 | 5.27 | 5.10 |
| Current Ratio | 0.67 | 0.72 | 0.85 |
| Quick Ratio | 0.57 | 0.59 | 0.71 |
| Financial Leverage | 3.59 | 3.64 | 3.67 |
⚠️ While the company sustains a high leverage, maintaining financial discipline is crucial in maintaining creditworthiness and funding long-term growth.
Fundamental Strength & Profitability
The company's ability to generate profits and its operational efficiency are reflected in key financial ratios provided below.
| Metric | 2024 | 2023 | 2022 |
|---|---|---|---|
| Return on Equity | 9.92% | 10.05% | 10.41% |
| Return on Assets | 2.76% | 2.76% | 2.84% |
| Net Margin | 14.40% | 12.47% | 11.34% |
| EBIT Margin | 20.21% | 18.51% | 16.50% |
| EBITDA Margin | 41.60% | 36.58% | 33.18% |
| Gross Margin | 45.74% | 42.09% | 38.28% |
| Research & Development to Revenue | 0% | 0% | 0% |
✅ The financial data reflect steady profitability over the years, with particular strength in maintaining gross and EBITDA margins.
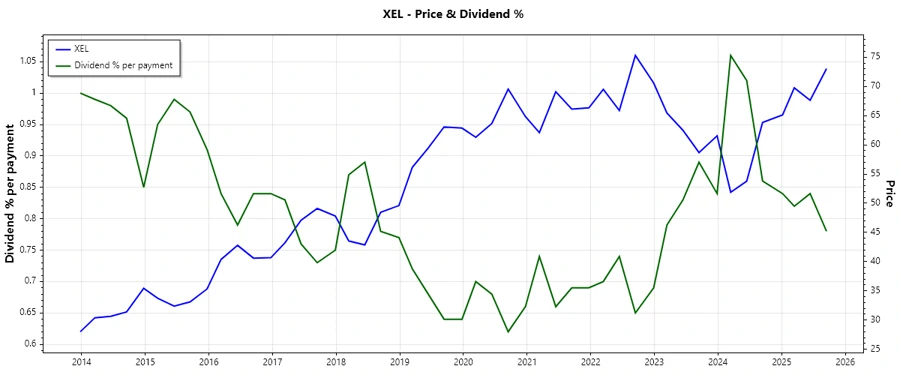
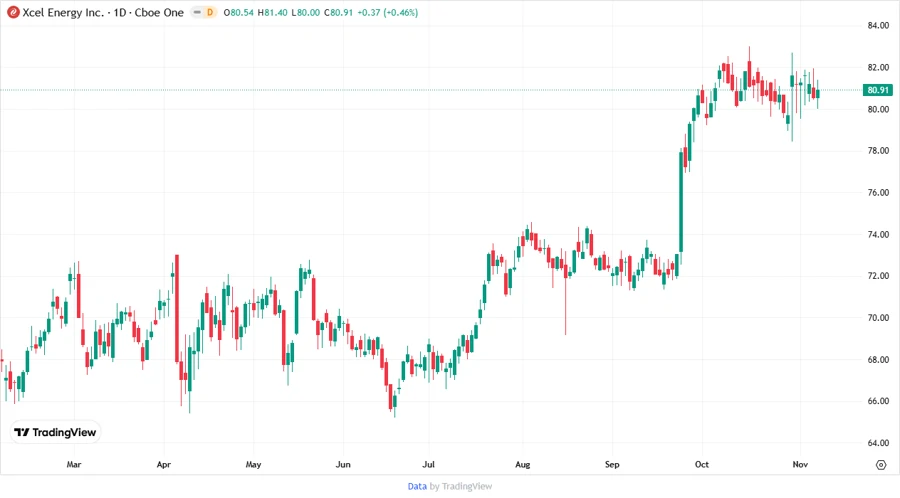
Price Development
Dividend Scoring System
| Category | Score | Score Bar |
|---|---|---|
| Dividend yield | 4 | |
| Dividend stability | 3 | |
| Dividend growth | 2 | |
| Payout ratio | 2 | |
| Financial stability | 3 | |
| Dividend continuity | 3 | |
| Cashflow Coverage | 2 | |
| Balance Sheet Quality | 3 |
Overall Score: 22/40
Rating
🗣️ Given the solid yet challenged dividend profile, Xcel Energy Inc. merits a cautious investment outlook. While its consistent dividend history is appealing, the recent cut in 2024 and current high payout ratios invite a neutral stance, warranting observation on dividend growth and financial strategy improvements.
Smart Data Insight
Master the Perfect Entry & Exit for this Stock
Don't leave your profits to chance. Historically, this stock follows specific seasonal patterns that institutional traders use to maximize returns.
- ✅ Identify the "Golden Buying Window"
- ✅ Avoid high-risk correction cycles
- ✅ Backtested data from the last 20+ years