June 08, 2025 a 03:31 pm
XEL: Dividend Analysis - Xcel Energy Inc.
Xcel Energy Inc. demonstrates stable dividend performance over a significant history of 42 years. Despite recent fluctuations in growth, the company maintains a commendable dividend yield of 3.26%. However, a recent dividend cut in 2024 raises caution about future stability. It is crucial to assess comprehensive financial metrics to gauge sustainability over the long term.
📊 Overview
Examining the fundamental dividend characteristics of Xcel Energy Inc. reveals a solid history with 42 years of consistent payments. However, the recent reduction in dividends prompts a detailed analysis of the sustainability and growth prospects.
| Attribute | Detail |
|---|---|
| Sector | Utilities |
| Dividend yield | 3.26% |
| Current dividend per share | 2.09 USD |
| Dividend history | 42 years |
| Last cut or suspension | 2024 |
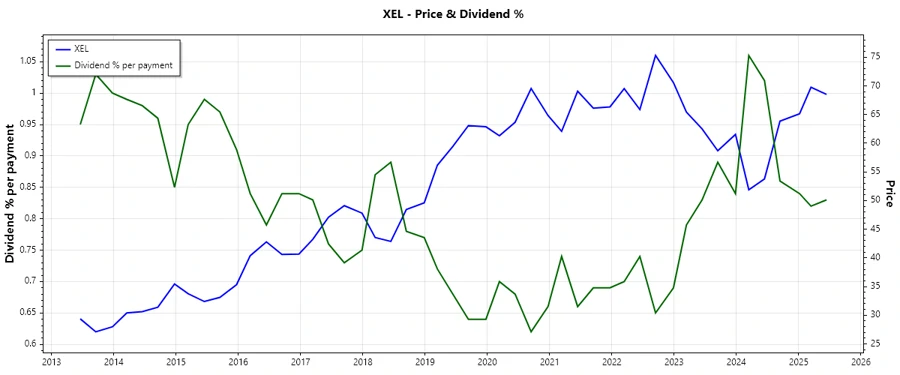
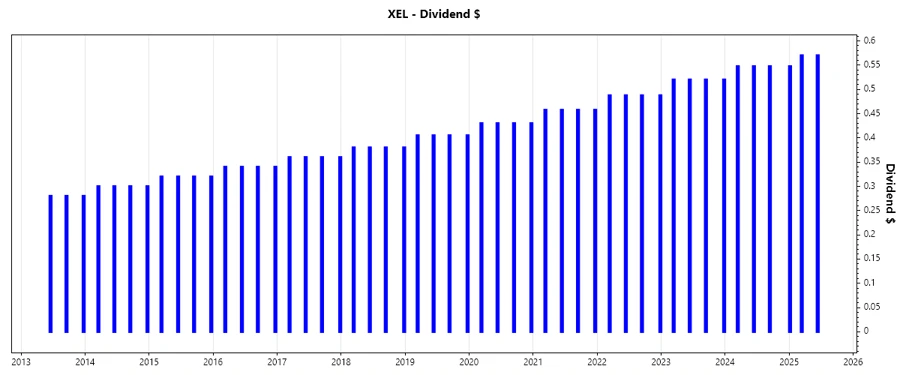
🗣️ Dividend History
Xcel Energy Inc.'s long-standing history of dividend payments reflects its commitment to returning value to shareholders. However, understanding past trends and recent cuts is essential for future predictions.
| Year | Dividend per Share (USD) |
|---|---|
| 2025 | 1.6875 |
| 2024 | 1.6425 |
| 2023 | 2.08 |
| 2022 | 1.95 |
| 2021 | 1.83 |
📈 Dividend Growth
Assessing dividend growth reveals modest pluses with a 0.28% increase over five years, despite a recent three-year downturn. Growth stability is critical for a long-term dividend-focused investment strategy.
| Time | Growth |
|---|---|
| 3 years | -3.54% |
| 5 years | 0.28% |
The average dividend growth is 0.28% over 5 years. This shows moderate but steady dividend growth.
✅ Payout Ratio
The payout ratios based on EPS (62.15%) and free cash flow (-379.72%) indicate a need for scrutiny. The discrepancies highlight potential risks if financial conditions tighten.
| Key Figure | Ratio |
|---|---|
| EPS-based | 62.15% |
| Free cash flow-based | -379.72% |
High EPS ratio is sustainable, but negative FCF ratio suggests pressure on cash flows. It signals the risk of using above-normal capital resources to fulfill dividend obligations.
📊 Cashflow & Capital Efficiency
The evaluation of cash flows offers insights into financial robustness. Metrics such as free cash flow yield are integral to supporting dividend payouts, yet current yield is negative, signaling potential constraints.
| Metrics | 2022 | 2023 | 2024 |
|---|---|---|---|
| Free Cash Flow Yield | -1.84% | -1.54% | -7.16% |
| Earnings Yield | 4.53% | 5.18% | 5.09% |
| CAPEX to Operating Cash Flow | 1.17 | 1.10 | 1.59 |
| Stock-based Compensation to Revenue | 0.13% | 0.18% | 0.25% |
| Free Cash Flow / Operating Cash Flow Ratio | -17.96% | -9.89% | -58.67% |
The unfavorable free cash flow yield reflects a potential imbalance in capital utilization. Constant monitoring is vital for sustainable dividend coverage.
⚠️ Balance Sheet & Leverage Analysis
A sturdy balance sheet supports strategic flexibility in capital allocation. Current metrics show a notable leverage, highlighting areas of potential financial exposure.
| Metrics | 2022 | 2023 | 2024 |
|---|---|---|---|
| Debt-to-Equity | 1.56 | 1.56 | 1.55 |
| Debt-to-Assets | 0.43 | 0.43 | 0.43 |
| Debt-to-Capital | 0.61 | 0.61 | 0.61 |
| Net Debt to EBITDA | 5.17 | 5.27 | 5.58 |
| Current Ratio | 0.85 | 0.72 | 0.80 |
| Quick Ratio | 0.71 | 0.59 | 0.57 |
| Financial Leverage | 3.67 | 3.64 | 3.59 |
The current leverage increases the risk profile, suggesting potential impacts on fiscal flexibility. Prudence in managing leverage is paramount.
📉 Fundamental Strength & Profitability
Foundational financial strength and profitability play critical roles in long-term stakeholder wealth. Xcel's profitability metrics indicate stable performance while underscoring a focus on enhanced efficiency.
| Metrics | 2022 | 2023 | 2024 |
|---|---|---|---|
| Return on Equity | 10.41% | 10.05% | 9.92% |
| Return on Assets | 2.84% | 2.76% | 2.76% |
| Margins: Net | 11.34% | 12.47% | 14.40% |
| Margins: EBIT | 16.50% | 18.51% | 20.21% |
| Margins: EBITDA | 32.74% | 36.58% | 41.57% |
| Margins: Gross | 38.28% | 41.77% | 45.74% |
| Research & Development to Revenue | 0% | 0% | 0% |
Steady ROE and slight improvement in margins reflect efficient utilization of resources. However, stagnation demands innovative enhancements in revenue streams.
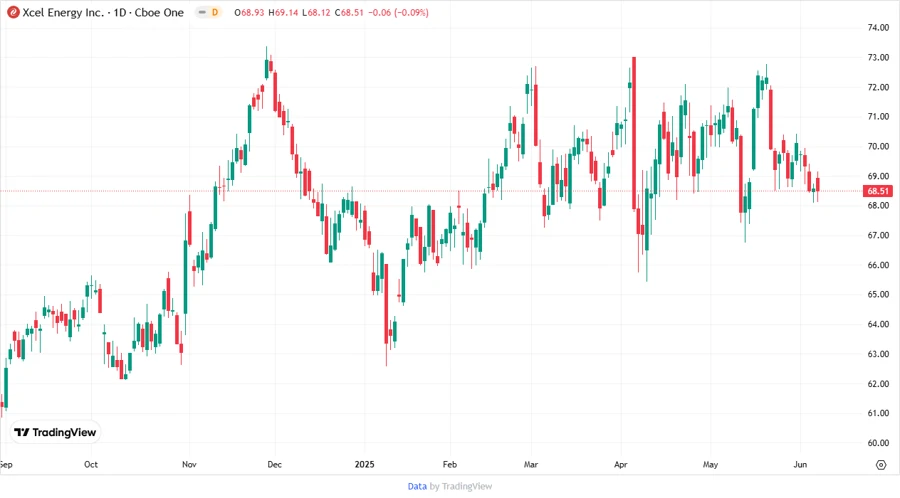
Price Development
✅ Dividend Scoring System
| Criteria | Score | Score Bar |
|---|---|---|
| Dividend yield | 4 | |
| Dividend Stability | 3 | |
| Dividend Growth | 2 | |
| Payout Ratio | 3 | |
| Financial Stability | 3 | |
| Dividend Continuity | 5 | |
| Cashflow Coverage | 2 | |
| Balance Sheet Quality | 2 |
Total Score: 24/40
Rating
Xcel Energy Inc. operates within the utilities sector with a commendable historical dividend track record. While the yield is attractive, recent cuts signal underlying challenges requiring careful scrutiny. Continued financial discipline and strategic operations are essential to bolster confidence and ensure future payout strength. Current holders should remain cautious but committed, while prospective investors evaluate entry on stability reinforcement.
Smart Data Insight
Master the Perfect Entry & Exit for this Stock
Don't leave your profits to chance. Historically, this stock follows specific seasonal patterns that institutional traders use to maximize returns.
- ✅ Identify the "Golden Buying Window"
- ✅ Avoid high-risk correction cycles
- ✅ Backtested data from the last 20+ years