May 19, 2026 a 04:03 am
WY: Trend and Support & Resistance Analysis - Weyerhaeuser Company
Weyerhaeuser Company, a leader in the timberlands and wood products industry, faces a dynamic market environment. Its substantial landholdings and sustainability practices position it well, yet fluctuating timber prices and economic cyclicality pose risks. The stock has witnessed fluctuating movements, with key trends identified in recent performance.
Trend Analysis
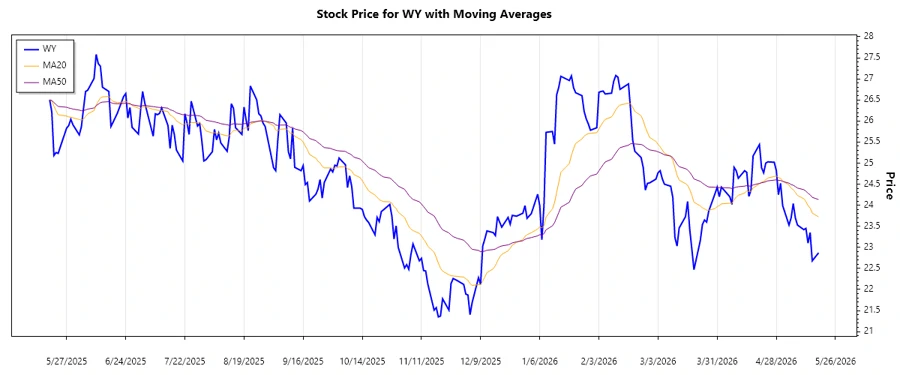
Based on the data, we observe a ▼ dominant downward trend as the EMA20 is consistently below EMA50 for the evaluated period. There is no indication of significant momentum upward.
| Date | Close Price | Trend |
|---|---|---|
| 2026-05-18 | 22.87 | ▼ |
| 2026-05-15 | 22.68 | ▼ |
| 2026-05-14 | 23.35 | ▼ |
| 2026-05-13 | 23.10 | ▼ |
| 2026-05-12 | 23.45 | ▼ |
| 2026-05-11 | 23.42 | ▼ |
| 2026-05-08 | 23.53 | ▼ |
The downward trend indicates a potential continued bearish sentiment. This might caution investors to seek other opportunities or to short the stock.
Support and Resistance
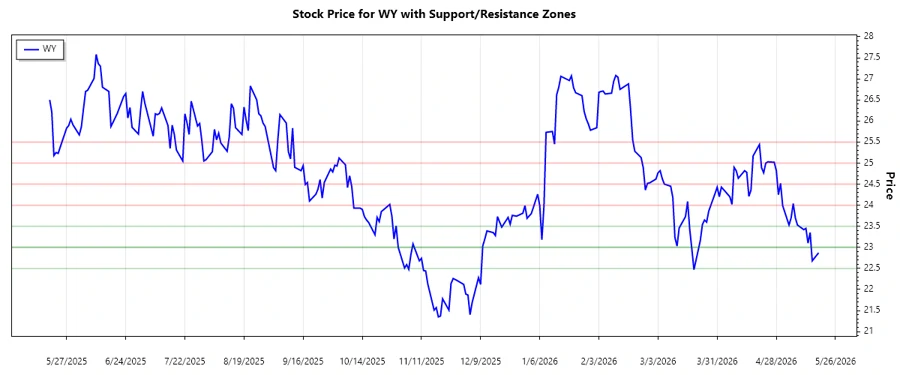
Examining recent price data, significant support and resistance zones were identified.
| Zone Type | From | To | Zone Analysis |
|---|---|---|---|
| Support | 23.00 | 23.50 | ▼ |
| Support | 22.50 | 23.00 | ▼ |
| Resistance | 24.00 | 24.50 | ▲ |
| Resistance | 25.00 | 25.50 | ▲ |
The stock is currently trading within the support zone of 22.50 to 23.00, indicative of bearish pressure.
Technical analysis advises caution, as the breach of strong support may signal further downside risks. Monitoring these zones is crucial for investment decisions.
Conclusion
Weyerhaeuser Company's stock analysis reveals a downward trend, presenting a cautious outlook. The support zones pose a critical juncture; breach could lead to further declines. However, the company’s strong industry position and sustainability focus may offer long-term opportunities. Current technical signals indicate a more defensive posture for investors. Vigilance in monitoring key technical levels remains essential in navigating this environment.
Smart Data Insight
Master the Perfect Entry & Exit for this Stock
Don't leave your profits to chance. Historically, this stock follows specific seasonal patterns that institutional traders use to maximize returns.
- ✅ Identify the "Golden Buying Window"
- ✅ Avoid high-risk correction cycles
- ✅ Backtested data from the last 20+ years