January 12, 2026 a 03:15 am
WY: Trend and Support & Resistance Analysis - Weyerhaeuser Company
The Weyerhaeuser Company's stock (WY) has shown significant movements recently. An analysis of the recent trading data suggests that there are underlying trends and potential zones of support and resistance. As an experienced player in the timber and wood products industry, Weyerhaeuser's performance can be influenced by numerous economic factors. This technical analysis will focus on the stock's recent trend evaluation and the identification of crucial support and resistance levels to provide a better understanding to potential investors.
Trend Analysis
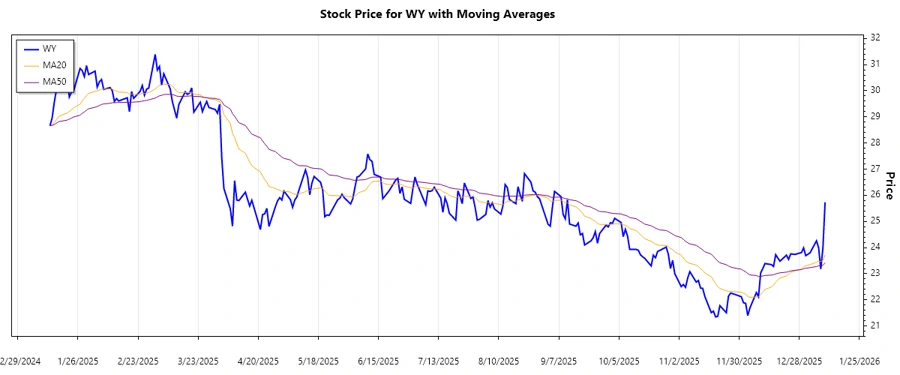
The trend analysis focuses on the exponential moving averages (EMA) to identify the recent market direction of WY stock.
| Date | Close Price | Trend |
|---|---|---|
| 2026-01-09 | $25.73 | ▲ Uptrend |
| 2026-01-08 | $23.99 | ▼ Downtrend |
| 2026-01-07 | $23.18 | ▼ Downtrend |
| 2026-01-06 | $23.99 | ⚖️ Sideways |
| 2026-01-05 | $24.26 | ▲ Uptrend |
| 2026-01-02 | $23.80 | ⚖️ Sideways |
| 2025-12-31 | $23.69 | ▼ Downtrend |
The current trend indicates a mixed movement with a tendency towards a slight uptrend. The discrepancy between the EMA20 and the EMA50 suggests intermittent volatility yet resilience at current levels.
Support- and Resistance
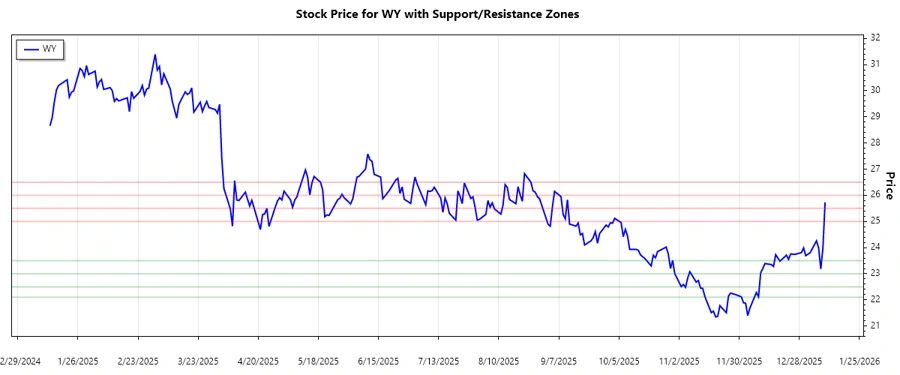
The analysis identifies key support and resistance levels using recent stock price data.
| Type | Zone Range |
|---|---|
| Support | $22.10 - $22.50 |
| Support | $23.00 - $23.50 |
| Resistance | $25.00 - $25.50 |
| Resistance | $26.00 - $26.50 |
The most recent price of $25.73 falls within the second resistance zone, indicating potential for either a breakthrough or a retracement if this level holds strong.
Conclusion
The technical analysis of Weyerhaeuser’s stock suggests a nuanced positioning between the defined support and resistance levels. While the prevailing trend appears mixed, the proximity to key resistance zones provides an opportunity for upward momentum if breached. Conversely, failure to surpass these levels might lead to a downside correction. These dynamic aspects need careful consideration by investors, especially within the volatile timber industry. Navigating these technical patterns can provide critical insights for optimizing entry and exit strategies.