
July 10, 2026 a 03:15 pm
WY: Fibonacci Analysis - Weyerhaeuser Company
Weyerhaeuser Company, represented by the ticker WY, has shown resilient performance with its unique position in the timberlands sector. As one of the largest private owners of timberlands, the company's strategic moves and investment in sustainable practices might soon reflect in its stock performance. Recent technical analyses provide insight into potential market movements that investors may find useful.
Fibonacci Analysis
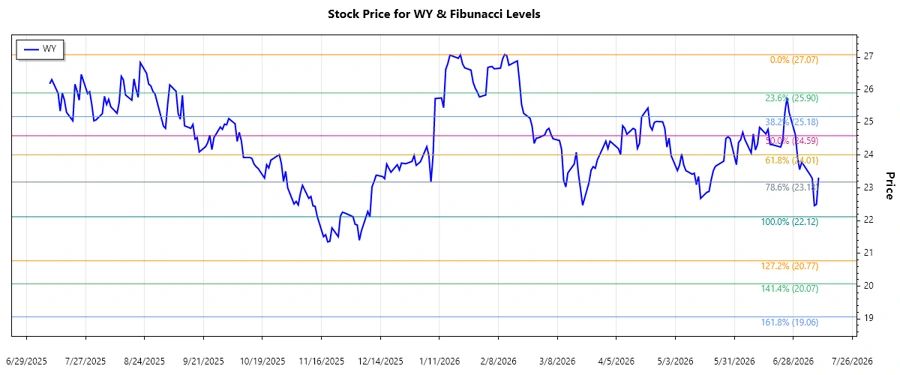
The recent data analysis of Weyerhaeuser Company indicates a dominant downtrend from January 20, 2026, to July 10, 2026. The price peaked at $27.07 on January 21, 2026, and bottomed at $22.12 as of July 9, 2026. This decline provides a basis for a Fibonacci retracement analysis, aiming to forecast potential reversal levels.
| Trend | Start Date | End Date | High (Price & Date) | Low (Price & Date) |
|---|---|---|---|---|
| Downtrend | 2026-01-20 | 2026-07-10 | $27.07 (2026-01-21) | $22.12 (2026-07-09) |
| Fibonacci Level | Price |
|---|---|
| 23.6% | $23.28 |
| 38.2% | $24.15 |
| 50% | $24.60 |
| 61.8% | $25.05 |
| 78.6% | $25.68 |
The current price at $23.315 suggests that the stock is hovering near the 23.6% Fibonacci retracement level. This level could potentially act as a resistance point. If the price breaks above this, further upward movement might be indicated, possibly reaching higher retracement levels.
Conclusion
The technical analysis of Weyerhaeuser Company indicates caution as the stock remains in a downtrend, with a current price near significant Fibonacci retracement levels. Investors should be aware of the potential resistance near $23.28. If the stock ascends beyond this level, it could signal a reversal or consolidation, providing trading opportunities. Risks remain tied to the wider market conditions and the company's strategic performance in the forestry sector.
Smart Data Insight
Master the Perfect Entry & Exit for this Stock
Don't leave your profits to chance. Historically, this stock follows specific seasonal patterns that institutional traders use to maximize returns.
- ✅ Identify the "Golden Buying Window"
- ✅ Avoid high-risk correction cycles
- ✅ Backtested data from the last 20+ years