
July 08, 2026 a 07:46 am

WY: Dividend Analysis - Weyerhaeuser Company
The analysis of Weyerhaeuser Company reveals a multifaceted dividend profile characterized by a substantial history of payments, yet challenges in profit reinvestment and cash flow stability. Though the dividend yield appears attractive, the high payout ratio demands cautious interpretation, especially considering periodic dividend cuts. The lingering negative free cash flow yield underscores potential headwinds in maintaining dividend sustainability. Despite profitability and strong asset returns, these metrics must be balanced with understanding the company's leverage and cash position.
📊 Overview
The Weyerhaeuser Company operates in a cyclical sector, influenced by housing and construction dynamics, reflected in its steady dividend history. However, the strategic oversight is pivotal owing to their significant market cap and dividend yield.
| Description | Value |
|---|---|
| Sector | Materials |
| Dividend yield | 3.43 % |
| Current dividend per share | 0.84 USD |
| Dividend history | 50 years |
| Last cut or suspension | None |
📈 Dividend History
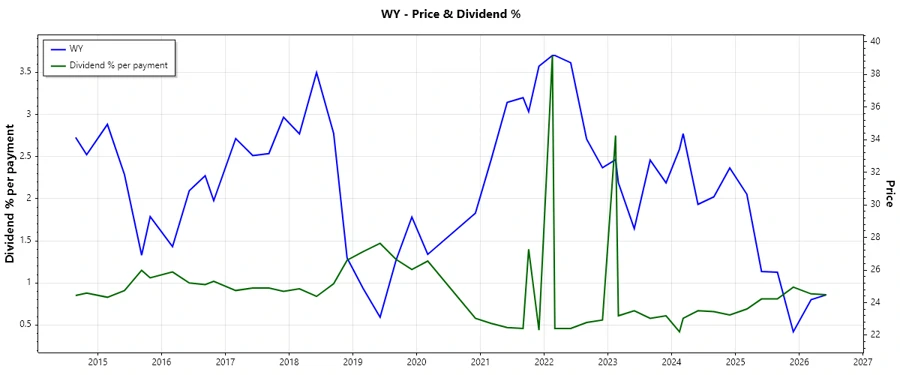
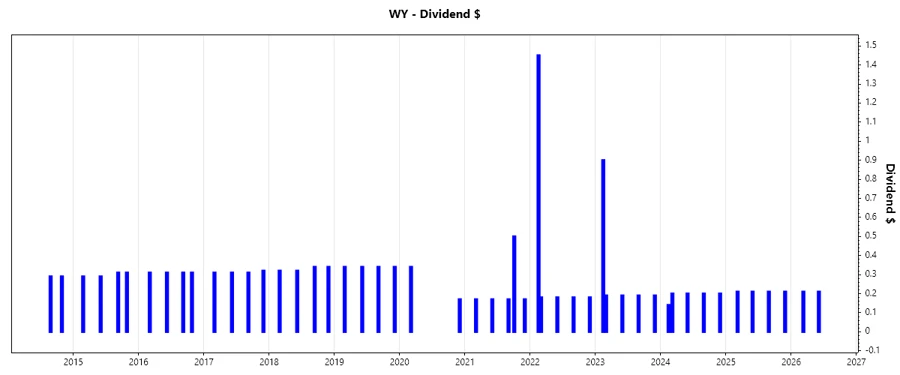
Analyzing the dividend history of Weyerhaeuser Company reveals resilient payouts over the years. Nonetheless, the sporadic increases in dividends suggest cyclical pressures impacting the firm's cash flow.
| Year | Dividend Per Share (USD) |
|---|---|
| 2026 | 0.42 |
| 2025 | 0.84 |
| 2024 | 0.94 |
| 2023 | 1.66 |
| 2022 | 2.17 |
📊 Dividend Growth
Weyerhaeuser's dividend growth presents sluggish momentum. While sustainability remains a core focus, the 5-year growth suggests stable but tepid improvements over a longer horizon.
| Time | Growth |
|---|---|
| 3 years | -0.27 % |
| 5 years | 0.10 % |
The average dividend growth is 0.10 % over 5 years. This shows moderate but steady dividend growth, ensuring some level of investor confidence despite a near-term decline.
🗣️ Payout Ratio
The payout ratios offer an understanding of a company's strategy towards capital distribution versus reinvestment. The elevated EPS-based payout ratio suggests an over-commitment to dividends, hence posing risks on future growth prospects.
| Key figure | Ratio |
|---|---|
| EPS-based | 152.64 % |
| Free cash flow-based | -146.33 % |
With an EPS payout at 152.64 % and FCF at -146.33 %, the dividend expenses are outpacing earnings, possibly challenging the company's financial equilibrium in future fiscal periods.
📉 Cashflow & Capital Efficiency
Evaluating cash flows illuminates operational resilience or gaps in capital efficiency. A negative FCF yield highlights pressing liquidity management issues, essential for sustained business vitality.
| Metric | 2023 | 2024 | 2025 |
|---|---|---|---|
| Free Cash Flow Yield | -2.46% | 1.66% | 0.51% |
| Earnings Yield | 2.36% | 1.93% | 1.90% |
| CAPEX to Operating Cash Flow | 1.76 | 0.66 | 0.84 |
| Stock-based Compensation to Revenue | 0.65% | 0.60% | 0.62% |
| Free Cash Flow / Operating Cash Flow Ratio | 15.66% | 33.83% | 15.65% |
| Return on Invested Capital | 3.25% | 4.02% | 2.93% |
A focus on improving cash-based efficiencies and high capex implies a directional change; caution is warranted to avoid financial strain.
📉 Balance Sheet & Leverage Analysis
Understanding leverage ratios is critical in gauging financial risk exposure and future solvency. The balanced debt metrics currently reflect stability, yet upcoming maturities warrant ongoing scrutiny.
| Metric | 2023 | 2024 | 2025 |
|---|---|---|---|
| Debt-to-Equity | 0.50 | 0.53 | 0.59 |
| Debt-to-Assets | 0.30 | 0.31 | 0.34 |
| Debt-to-Capital | 0.33 | 0.34 | 0.37 |
| Net Debt to EBITDA | 2.29 | 3.69 | 4.90 |
| Current Ratio | 2.94 | 1.79 | 1.29 |
| Quick Ratio | 2.22 | 1.17 | 0.83 |
| Financial Leverage | 1.66 | 1.70 | 1.76 |
Balanced leverage ratios signal an adaptive financial model, though the heightened net-debt metrics are early warnings of potential debt stress.
📊 Fundamental Strength & Profitability
The profitability ratios provide an insightful glance into operational proficiency. Margins reflect core profitability, essential for growth and investor interest.
| Metric | 2023 | 2024 | 2025 |
|---|---|---|---|
| Return on Equity | 8.20% | 4.07% | 3.44% |
| Return on Assets | 4.94% | 2.39% | 1.95% |
| Net Profit Margin | 10.93% | 5.56% | 4.69% |
| EBIT Margin | 15.86% | 9.77% | 7.72% |
| EBITDA Margin | 22.37% | 16.82% | 15.09% |
| Gross Margin | 21.92% | 18.43% | 7.47% |
| R&D to Revenue | 0.09% | 0.10% | 0.00% |
Profitability highlights depict operational robustness, yet the declining trend in margins should be closely monitored for strategic adjustments.
📈 Price Development
✅ Dividend Scoring System
| Criteria | Score | Score Bar |
|---|---|---|
| Dividend yield | 3 | |
| Dividend stability | 4 | |
| Dividend growth | 2 | |
| Payout ratio | 1 | |
| Financial stability | 3 | |
| Dividend continuity | 5 | |
| Cashflow Coverage | 2 | |
| Balance Sheet Quality | 3 |
Total Score: 23 / 40
🗣️ Rating
Weyerhaeuser Company presents an intriguing dividend proposition with robust historical continuity, albeit tempered by elevated payout ratios and variable cash flows. Investors should weigh these factors against broader economic climate and sectoral trends. A cautious buy is recommended for investors prioritizing long-term dividend consistency but wary of short-term fiscal strains.
Smart Data Insight
Master the Perfect Entry & Exit for this Stock
Don't leave your profits to chance. Historically, this stock follows specific seasonal patterns that institutional traders use to maximize returns.
- ✅ Identify the "Golden Buying Window"
- ✅ Avoid high-risk correction cycles
- ✅ Backtested data from the last 20+ years