September 05, 2025 a 07:32 am


WY: Dividend Analysis - Weyerhaeuser Company
The Weyerhaeuser Company, operating for decades, showcases a robust dividend history with significant yield and challenges in dividend growth. Despite a high dividend payout ratio and recent financial strain, it maintains a steady dividend policy, leveraging its forestry operations to sustain shareholder returns.
📊 Overview
Weyerhaeuser operates within the Real Estate sector, primarily dealing with timberlands. It offers a current dividend yield of 3.21% with a dividend per share of $0.939, reflecting stability over its 49-year dividend history, with no recent cut or suspension.
| Metric | Value |
|---|---|
| Sector | Real Estate |
| Dividend yield | 3.21 % |
| Current dividend per share | $0.939 |
| Dividend history | 49 years |
| Last cut or suspension | None |
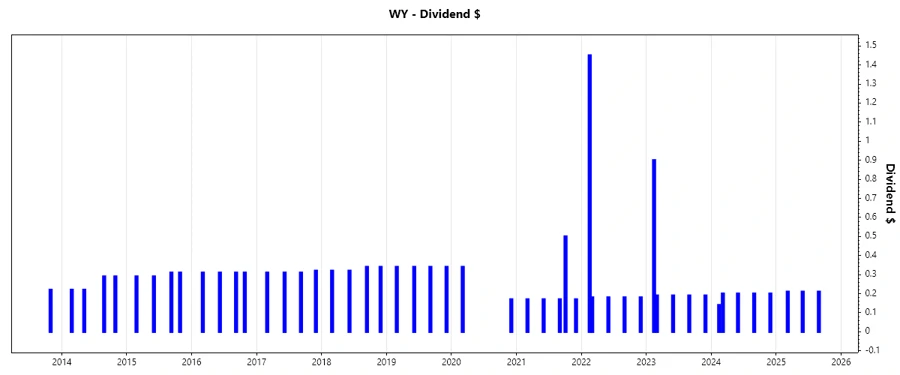
📈 Dividend History
The dividend history is a testament to the company's commitment to shareholders, crucial for assessing potential income stability. The company's consistent dividend payment reflects resilience amidst market shifts.
| Year | Dividend per Share (USD) |
|---|---|
| 2025 | 0.63 |
| 2024 | 0.94 |
| 2023 | 1.66 |
| 2022 | 2.17 |
| 2021 | 1.18 |
📉 Dividend Growth
Dividend growth indicates future income potential and sustainability. Over the last 3 years, growth has been negative at -7.30%, and over 5 years at -7.12%, a sign of potential struggles in maintaining growth.
| Time | Growth |
|---|---|
| 3 years | -7.30 % |
| 5 years | -7.12 % |
The average dividend growth is -7.12% over 5 years. This indicates challenges and a need for strategic adjustments moving forward.
✅ Payout Ratio
The payout ratio offers insight into dividend sustainability. Alarmingly, Weyerhaeuser's EPS-based payout ratio stands high at 243.57%, and FCF-based at 179.72%. These figures suggest potential unsustainability unless earnings improve.
| Key figure | Ratio (%) |
|---|---|
| EPS-based | 243.57 % |
| Free cash flow-based | 179.72 % |
Weyerhaeuser's high payout ratios could present a risk to the stability of future dividends unless mitigated by growing profits or reduced payouts.
💼 Cashflow & Capital Efficiency
Cashflow and capital efficiency are crucial for evaluating a company's financial health. Despite low Free Cash Flow Yield at 2.05%, CAPEX to Operating Cash Flow is manageable at 58.93%. However, the high Stock-based Compensation to Revenue ratio may raise efficiency concerns.
| Metric | 2024 | 2023 | 2022 |
|---|---|---|---|
| Free Cash Flow Yield | 1.66 % | 2.96 % | 8.99 % |
| Earnings Yield | 1.93 % | 3.30 % | 8.17 % |
| CAPEX to Operating Cash Flow | 66.17 % | 47.45 % | 26.94 % |
| Stock-based Compensation to Revenue | 0 % | 0.47 % | 0.32 % |
| Free Cash Flow / Operating Cash Flow Ratio | 33.83 % | 52.55 % | 73.06 % |
The cashflow figures signal potential issues with financial stability, despite moderate capital efficiency metrics. Strategic adjustments could enhance financial health substantially.
📊 Balance Sheet & Leverage Analysis
A robust balance sheet is essential for withstanding financial adversities and supporting dividend payments. Weyerhaeuser's Debt-to-Equity ratio of 0.525 demonstrates moderate leverage.
| Metric | 2024 | 2023 | 2022 |
|---|---|---|---|
| Debt-to-Equity | 0.525 | 0.497 | 0.472 |
| Debt-to-Assets | 0.309 | 0.300 | 0.293 |
| Debt-to-Capital | 0.344 | 0.332 | 0.321 |
| Net Debt to EBITDA | 3.690 | 2.285 | 0.991 |
| Current Ratio | 0 | 0 | 1.578 |
| Quick Ratio | 1.168 | 2.217 | 1.262 |
| Financial Leverage | 1.701 | 1.659 | 1.613 |
Weyerhaeuser's leverage metrics suggest a manageable level of debt, with room for optimization to enhance financial resilience against market fluctuations.
📈 Fundamental Strength & Profitability
Profitability and operational efficiency underpin long-term growth. The company's Return on Equity and Assets depicts a moderate performance, complemented by its Gross and Net Margins.
| Metric | 2024 | 2023 | 2022 |
|---|---|---|---|
| Return on Equity | 4.07 % | 8.20 % | 17.49 % |
| Return on Assets | 2.39 % | 4.94 % | 10.84 % |
| Margins: Net | 5.56 % | 10.93 % | 18.46 % |
| Margins: EBIT | 9.77 % | 15.86 % | 25.28 % |
| Margins: EBITDA | 16.82 % | 22.37 % | 34.62 % |
| Margins: Gross | 18.43 % | 21.92 % | 35.55 % |
| Research & Development to Revenue | 0.10 % | 0.09 % | 0.06 % |
The company's strong recent profitability trends and operational margins suggest a robust ability to sustain and grow operations in diverse market conditions.
📊 Price Development
📊 Dividend Scoring System
| Category | Score | Score Bar |
|---|---|---|
| Dividend yield | 4 | |
| Dividend Stability | 3 | |
| Dividend growth | 2 | |
| Payout ratio | 2 | |
| Financial stability | 3 | |
| Dividend continuity | 4 | |
| Cashflow Coverage | 3 | |
| Balance Sheet Quality | 3 |
Total Points: 24/40
📈 Rating
In conclusion, Weyerhaeuser Company presents a balanced, albeit challenging dividend profile with solid historic dividends but recent financial strains. The recommendation is to cautiously watch the company's strategies for profit and growth augmentation. While demonstrating potential, improvements in key areas like payout and growth rates would enhance appeal to risk-averse investors. Strategic management in their timber operations promises a pathway to regaining robust financial health.
Smart Data Insight
Master the Perfect Entry & Exit for this Stock
Don't leave your profits to chance. Historically, this stock follows specific seasonal patterns that institutional traders use to maximize returns.
- ✅ Identify the "Golden Buying Window"
- ✅ Avoid high-risk correction cycles
- ✅ Backtested data from the last 20+ years