
July 22, 2026 a 10:15 am
WYNN: Fibonacci Analysis - Wynn Resorts, Limited
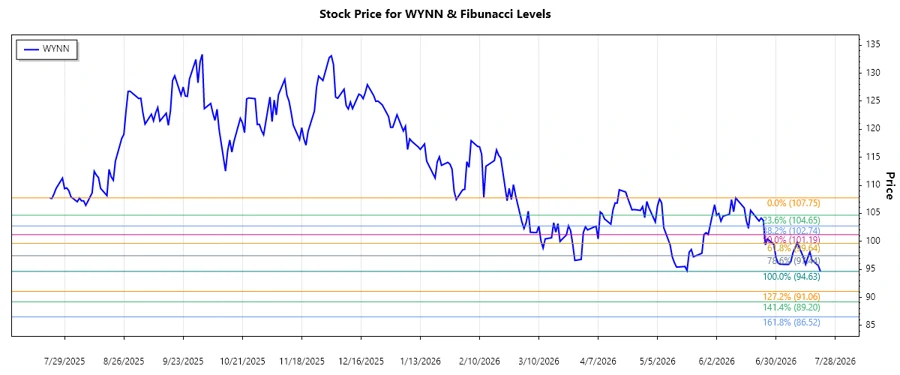
Wynn Resorts, Limited has showcased notable volatility in its recent price movement, reflecting both the opportunities and risks associated with its luxurious integrated resort business. As global travel and entertainment industries continue to recover and flourish, WYNN stock is an interesting prospect for investors seeking both growth and value in hospitality. Monitoring the technical levels, especially Fibonacci retracements, can provide an insightful avenue for potential investment decisions.
Fibonacci Analysis
| Detail | Value |
|---|---|
| Trend Start Date | 2026-06-11 |
| Trend End Date | 2026-07-21 |
| High Point (Price & Date) | 107.75 on 2026-06-11 |
| Low Point (Price & Date) | 94.63 on 2026-07-21 |
| Fibonacci Level | Price Level |
|---|---|
| 0.236 | 97.66 |
| 0.382 | 100.15 |
| 0.5 | 101.96 |
| 0.618 | 103.77 |
| 0.786 | 106.24 |
The current price is 94.63, which is below all Fibonacci retracement levels. This suggests that WYNN is currently in a stronger downtrend, and it hasn't yet started retracing back upwards.
Technical Interpretation: The price being below 0.236 typically indicates absence of near-term support from Fibonacci levels, suggesting the need for caution or more bearish sentiment until any upward retracement is observed.
Conclusion
WYNN is experiencing a significant downtrend with technical indicators showing it below the primary Fibonacci levels. The market appears cautious as prices are trading below support levels, hinting at potential further downside if no recovery occurs shortly. This position reflects possible investor skepticism around the short-term outlook for hospitality due to economic variables. However, the luxurious nature of Wynn Resorts’ core business offers strong resilience and potential for upside upon recovery in market sentiment or strong earnings. Investors should weigh these conditions alongside potential risks, evaluating broader economic indicators that influence travel and entertainment sectors.
Smart Data Insight
Master the Perfect Entry & Exit for this Stock
Don't leave your profits to chance. Historically, this stock follows specific seasonal patterns that institutional traders use to maximize returns.
- ✅ Identify the "Golden Buying Window"
- ✅ Avoid high-risk correction cycles
- ✅ Backtested data from the last 20+ years