
July 15, 2026 a 04:44 pm
WYNN: Fibonacci Analysis - Wynn Resorts, Limited
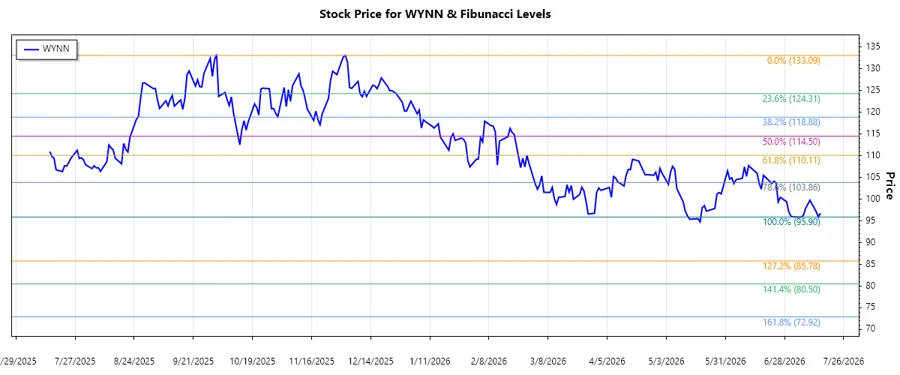
Wynn Resorts, Limited has experienced significant volatility, reflecting broader market trends. The stock's performance is influenced by the luxury tourism and gaming industry dynamics, given its significant investments in integrated resort properties. A recent technical analysis indicates a downward trend, providing an opportunity for investors to consider strategic entry points. The ongoing global economic developments will likely play a critical role in shaping the company's future price movements.
Fibonacci Analysis
| Attribute | Details |
|---|---|
| Trend Start Date | 2025-12-02 |
| Trend End Date | 2026-07-15 |
| High Price | $133.09 (2025-12-02) |
| Low Price | $95.90 (2026-07-14) |
| Fibonacci Level | Price |
|---|---|
| 0.236 | $105.39 |
| 0.382 | $110.20 |
| 0.5 | $114.50 |
| 0.618 | $118.80 |
| 0.786 | $124.47 |
The current price for WYNN is $96.81. It is below the 0.236 Fibonacci level, indicating that the stock is in a new chart pattern and forming potential support around the recent low.
Conclusion
Wynn Resorts, Limited's recent stock price trend highlights a dominant downtrend. Despite this, for technical analysts, this could signal potential buying opportunities when the price stabilizes or shows signs of reversing. Investors should be cautious of the macroeconomic factors influencing the luxury and gaming sectors, which could impact future price resilience. A careful watch on the stock's behavior around the identified Fibonacci levels is recommended to recognize possible support levels. Technical support below the 0.236 level suggests a look towards possible strategic entry points as temporary price weaknesses could convert into plausible opportunities. However, investors must remain vigilant about volatility, ensuring a responsive approach to changing market conditions.
Smart Data Insight
Master the Perfect Entry & Exit for this Stock
Don't leave your profits to chance. Historically, this stock follows specific seasonal patterns that institutional traders use to maximize returns.
- ✅ Identify the "Golden Buying Window"
- ✅ Avoid high-risk correction cycles
- ✅ Backtested data from the last 20+ years