
June 26, 2026 a 07:46 am

WYNN: Dividend Analysis - Wynn Resorts, Limited
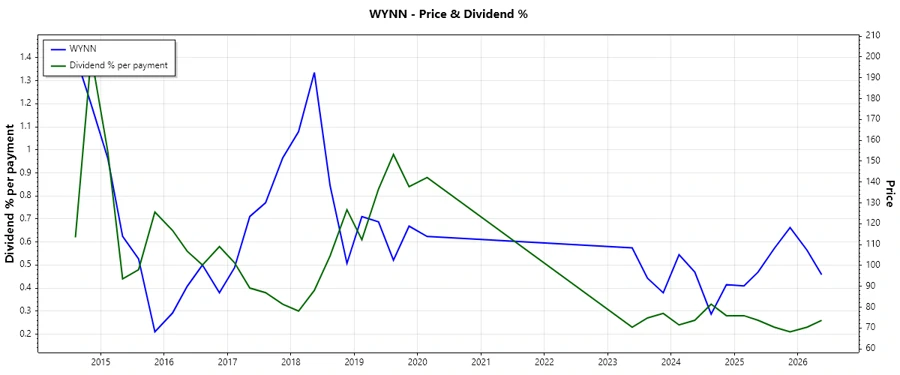
Wynn Resorts, Limited has a noteworthy dividend profile with a history of 18 years of payment. Whilst the current dividend yield stands at a modest 1.05%, reflective of a high stock market valuation, the company ensures a consistent payout. However, there are no significant dividend growth trends over the past three and five-year periods, which may concern growth investors. Evaluating the cash flow and payout ratios becomes crucial to determine the sustainability and reliability of these dividends.
📊 Overview
The investment case for Wynn Resorts, Limited is strengthened by its positioning in a high-demand sector. Its dividend yield of 1.05% is well-supported by a current dividend per share of USD 1.68, with an impressive history stretching 18 years. Despite the absence of recent dividend growth, the stable dividend history highlights a commitment to shareholder returns.
| Detail | Data |
|---|---|
| Sector | Hospitality/Gaming |
| Dividend yield | 1.05 % |
| Current dividend per share | 1.68 USD |
| Dividend history | 18 years |
| Last cut or suspension | None |
🗣️ Dividend History
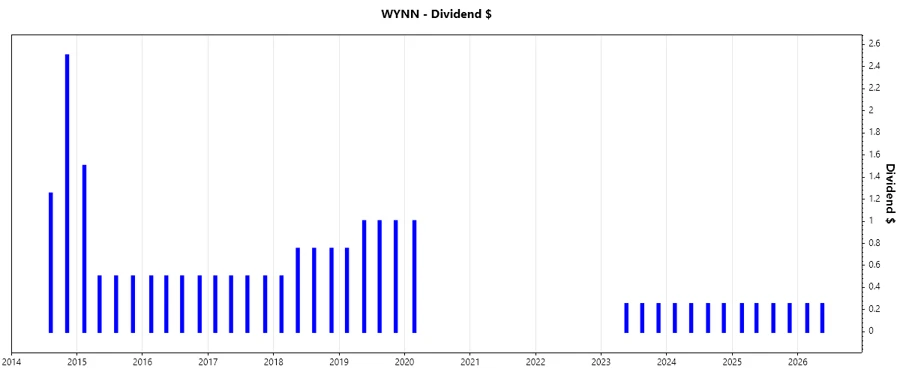
An examination of the historical dividend payments reveals robust consistency, vital for investor trust. Understanding past payments guides expectations on future reliability. Investors should note the intervals of dividend variation which may signal strategic capital allocation.
| Year | Dividend per Share (USD) |
|---|---|
| 2026 | 0.50 |
| 2025 | 1.00 |
| 2024 | 1.00 |
| 2023 | 0.75 |
| 2020 | 1.00 |
📈 Dividend Growth
The past growth rates are crucial in predicting future potential increases in dividend payouts. Astonishingly, both 3-year and 5-year growth rates linger at 0%, presenting a case for stable but zero growth expectations for income investors.
| Time | Growth |
|---|---|
| 3 years | 0 % |
| 5 years | 0 % |
The average dividend growth is 0% over 5 years. This shows moderate but steady dividend growth.
📉 Payout Ratio
Calculating the payout ratios is essential for understanding dividend plausibility. With an EPS-based payout ratio of 46.30% and 25.22% based on free cash flow, Wynn maintains a healthy threshold ensuring profit retention for business growth while rewarding shareholders.
| Key figure | Ratio |
|---|---|
| EPS-based | 46.3 % |
| Free cash flow-based | 25.2 % |
The payout ratios suggest a balanced management of dividends and retained earnings.
✅ Cashflow & Capital Efficiency
Analyzing cashflow metrics such as Free Cash Flow Yield and the efficiency of capital expenditure are integral to ensuring that dividends are sustainable without undermining growth potential.
| Year | 2025 | 2024 | 2023 |
|---|---|---|---|
| Free Cash Flow Yield | 0.055 | 0.106 | 0.072 |
| Earnings Yield | 0.026 | 0.053 | 0.071 |
| CAPEX to Operating Cash Flow | 0.489 | 0.296 | 0.406 |
| Stock-based Compensation to Revenue | 0.013 | 0.008 | 0.010 |
| Free Cash Flow / Operating Cash Flow Ratio | 0.511 | 0.704 | 0.594 |
While cash flow appears to be managed efficiently, the capital allocation supports ongoing operational demands and potential growth initiatives.
⚠️ Balance Sheet & Leverage Analysis
The company's leverage ratios highlight a precarious fiscal position with high debt-to-equity levels, urging cautious observance. The ability to cover liabilities is pivotal in sustaining its operations and safeguarding shareholder equity.
| Year | 2025 | 2024 | 2023 |
|---|---|---|---|
| Debt-to-Equity | -44.62 | -54.27 | -53.19 |
| Debt-to-Assets | 0.91 | 0.937 | 0.955 |
| Debt-to-Capital | 1.023 | 1.019 | 1.019 |
| Net Debt to EBITDA | 6.151 | 4.892 | 6.085 |
| Current Ratio | 1.633 | 1.898 | 1.928 |
| Quick Ratio | 1.579 | 1.849 | 1.893 |
| Financial Leverage | -49.006 | -57.896 | -55.677 |
Despite the challenging leverage ratios, Wynn's consistent ability to service debt underpins an avenue for potential financial improvement if managed prudently.
📊 Fundamental Strength & Profitability
Focusing on key profitability margins and returns provides insights into operational efficiency and potential future earnings growth.
| Year | 2025 | 2024 | 2023 |
|---|---|---|---|
| Return on Equity | -1.188 | -2.235 | -2.904 |
| Return on Assets | 0.024 | 0.039 | 0.052 |
| Margins: Net | 4.59% | 7.03% | 11.18% |
| EBIT | 15.97% | 18.68% | 15.87% |
| EBITDA | 24.66% | 27.93% | 26.40% |
| Gross | 32.73% | 43.51% | 43.22% |
| Research & Development to Revenue | 0% | 0% | 0% |
The company's profitability indicators reveal challenges, but focus on margin improvement can be a key driver for better financial outcomes.
📈 Price Development
📊 Dividend Scoring System
| Criterion | Score | Bar |
|---|---|---|
| Dividend yield | 2 | |
| Dividend Stability | 4 | |
| Dividend growth | 1 | |
| Payout ratio | 3 | |
| Financial stability | 2 | |
| Dividend continuity | 4 | |
| Cashflow Coverage | 3 | |
| Balance Sheet Quality | 2 |
Total Score: 21 out of 40 points
⚖️ Rating
In summary, Wynn Resorts offers a mixed dividend profile with well-maintained dividend history and stability. However, the weak growth in dividends and moderate cashflow and payout metrics call for selective investor attention. Cautious optimism is advised as the company shows resilience in maintaining its dividend amidst fiscal challenges.
Smart Data Insight
Master the Perfect Entry & Exit for this Stock
Don't leave your profits to chance. Historically, this stock follows specific seasonal patterns that institutional traders use to maximize returns.
- ✅ Identify the "Golden Buying Window"
- ✅ Avoid high-risk correction cycles
- ✅ Backtested data from the last 20+ years