May 18, 2026 a 07:46 am


WYNN: Dividend Analysis - Wynn Resorts, Limited
Wynn Resorts Limited, despite the challenges faced in a highly dynamic sector, has managed to maintain a consistent dividend payout strategy over the years. With its dividend yield standing slightly above 1%, potential investors might be keen to focus on the sustainability of dividend payments and its stock's underlying financial ratios. The company, with its years of experience in the hospitality sector, continues to ensure value return to stakeholders even amidst prevailing economic conditions.
📊 Overview
Wynn Resorts Limited operates within the competitive service sector with an emphasis on hospitality and gaming. The company's long-standing practice of offering dividends is apparent with a current yield of 1.05%, mirroring its endeavor to reward shareholders. The present dividend per share is $1.68, underpinning a robust dividend history of 18 years without any notable cuts or suspensions.
| Metric | Data |
|---|---|
| Sector | Services |
| Dividend yield | 1.05 % |
| Current dividend per share | 1.68 USD |
| Dividend history | 18 years |
| Last cut or suspension | None |
📉 Dividend History
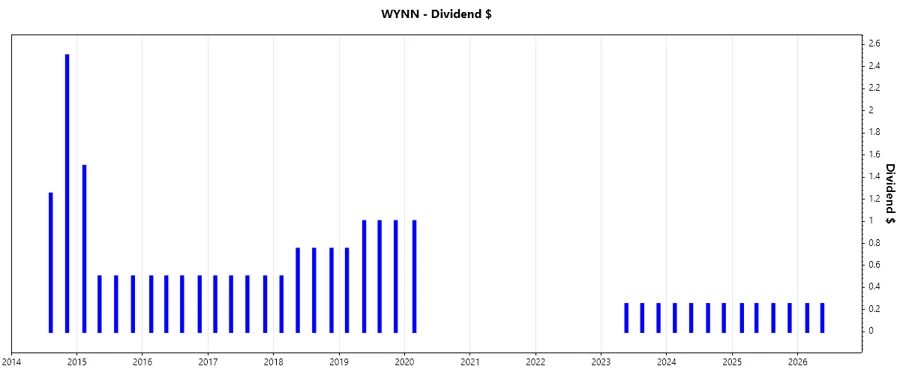
Analyzing Wynn Resorts Limited's dividend history unveils a consistent payout strategy aiming to ensure returns for investors. It's fundamental for understanding the stability and sense of security provided to shareholders. Monitoring previous payments, the company has shown resilience, maintaining dividends even during volatile periods.
| Year | Dividend Per Share (USD) |
|---|---|
| 2026 | 0.50 |
| 2025 | 1.00 |
| 2024 | 1.00 |
| 2023 | 0.75 |
| 2020 | 1.00 |
📈 Dividend Growth
Dividend growth is a critical indicator of a firm's commitment to increasing shareholder value. For Wynn Resorts Limited, tracking changes over time indicates the firm’s capability to grow dividends, aligning with its earnings and cash flow generation capabilities.
| Time | Growth |
|---|---|
| 3 years | 0 % |
| 5 years | 0 % |
The average dividend growth is 0% over 5 years. While this signals no nominal growth, it indicates the emphasis on maintaining current payout levels amidst fluctuating market conditions.
✅ Payout Ratio
The payout ratio sheds light on the proportion of earnings distributed as dividends, reflecting sustainability. Wynn Resorts demonstrates a comprehensive EPS-based ratio of 46.30% and FCF-based ratio of 25.22%, suggesting balanced reinvestment strategies alongside returns to shareholders.
| Key figure ratio | Data |
|---|---|
| EPS-based | 46.30 % |
| Free cash flow-based | 25.22 % |
A 46.30% EPS payout ratio is indicative of Wynn Resort's ability to balance future growth investments and shareholder returns. The 25.22% FCF ratio further ensures cash allocations are judiciously managed in line with their financial goals.
🗣️ Cashflow & Capital Efficiency
Cashflow efficiency narrates how effectively a company utilizes its capital. Wynn Resorts has maintained a stable but moderate free cash flow yield, underscoring judicious investment in its strategic priorities while ensuring liquidity.
| Year | 2025 | 2024 | 2023 |
|---|---|---|---|
| Free Cash Flow Yield | 5.55 % | 10.59 % | 7.22 % |
| Earnings Yield | 2.62 % | 5.29 % | 7.12 % |
| CAPEX to Operating Cash Flow | 0.49 | 0.30 | 0.41 |
| Stock-based Compensation to Revenue | 1.29 % | 0.83 % | 0.99 % |
| Free Cash Flow / Operating Cash Flow Ratio | 51.17 % | 70.37 % | 59.36 % |
The FCF yield and capital efficiency depict Wynn's capacity to generate substantial cash flows efficiently, fostering an investment-friendly environment. Despite the high net debt to EBITDA, strategic capital spending might buffer against prolonged financial turbulence.
🗣️ Balance Sheet & Leverage Analysis
Understanding financial leverage and stability is key when analyzing a company's risk and viability. Wynn Resorts projects high leverage ratios but operating efficiencies are suggestive of strategies targeting long-term amelioration.
| Year | 2025 | 2024 | 2023 |
|---|---|---|---|
| Debt-to-Equity | -44.62 % | -54.27 % | -53.19 % |
| Debt-to-Assets | 91.05 % | 93.74 % | 95.53 % |
| Debt-to-Capital | 102.29 % | 101.88 % | 101.92 % |
| Net Debt to EBITDA | 6.15 | 4.89 | 6.08 |
| Current Ratio | 1.63 | 1.90 | 1.93 |
| Quick Ratio | 1.58 | 1.85 | 1.89 |
| Financial Leverage | -49.01 | -57.90 | -55.68 |
Despite high debt metrics, Wynn Resorts remains committed to improving its balance sheet. While the negative financial leverage is a recurring issue, strong operational management could mitigate longer-term solvency risks.
📈 Fundamental Strength & Profitability
Wynn Resorts’ profitability metrics are integral to assessing the firm’s comprehensive financial health. The variations in returns reflect the firm's capacity to optimize its asset use, supporting investor confidence.
| Year | 2025 | 2024 | 2023 |
|---|---|---|---|
| Return on Equity | -118.82 % | -223.53 % | -290.39 % |
| Return on Assets | 2.42 % | 3.86 % | 5.22 % |
| Net Margin | 4.59 % | 7.03 % | 11.18 % |
| EBIT Margin | 15.97 % | 18.68 % | 15.87 % |
| EBITDA Margin | 24.66 % | 27.93 % | 26.40 % |
| Gross Margin | 32.73 % | 43.51 % | 43.22 % |
| R&D to Revenue | 0 % | 0 % | 0 % |
Negative return on equity ratios indicate recent challenges, primarily driven by extensive debt obligations. Leveraging strategic parameters could enrich margins and yields in the forthcoming financial periods.
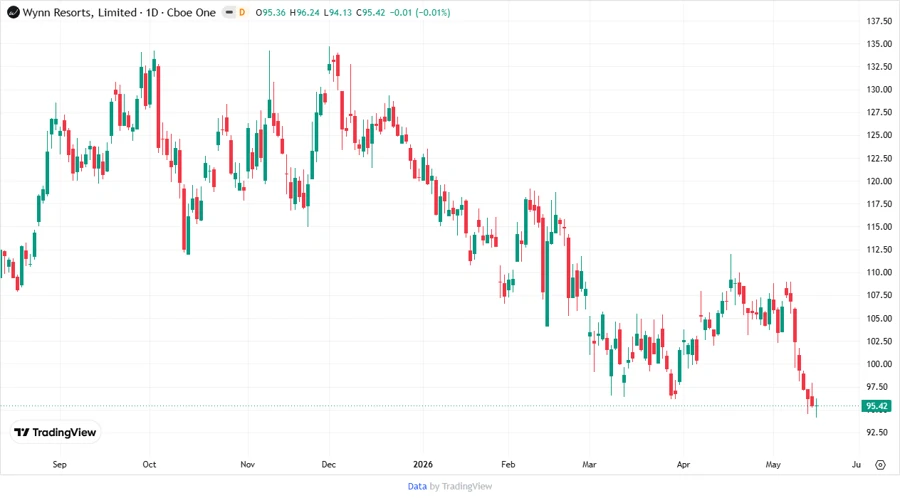
Price Development
✅ Dividend Scoring System
| Criteria | Score | Rating |
|---|---|---|
| Dividend yield | 2 | |
| Dividend stability | 4 | |
| Dividend growth | 1 | |
| Payout ratio | 3 | |
| Financial stability | 2 | |
| Dividend continuity | 5 | |
| Cashflow Coverage | 3 | |
| Balance Sheet Quality | 2 |
Total Score: 22/40
🗣️ Rating
Wynn Resorts exhibits strong dividend continuity and stability amidst a challenging financial landscape. Despite moderate dividend yields and the absence of recent growth, its proven track record could inspire confidence among stakeholders. It is crucial, however, for the firm to address financial leverage effectively to underpin long-term profitability.
Smart Data Insight
Master the Perfect Entry & Exit for this Stock
Don't leave your profits to chance. Historically, this stock follows specific seasonal patterns that institutional traders use to maximize returns.
- ✅ Identify the "Golden Buying Window"
- ✅ Avoid high-risk correction cycles
- ✅ Backtested data from the last 20+ years