February 11, 2026 a 12:47 pm

📊 WYNN: Dividend Analysis - Wynn Resorts, Limited
Wynn Resorts, Limited, with its considerable market capitalization, presents a fascinating dividend profile. The company has a longstanding history of dividend payments, albeit with recent fluctuations. While its dividend yield stands modestly below 1%, the payout ratios indicate a conservative financial strategy aimed at sustaining its dividend commitments.
Overview
✅ Wynn Resorts, Limited operates in the diversified hospitality sector. The company currently offers a dividend yield of 0.85%, reflecting its cautious dividend policy. Despite recent challenges, it boasts a 17-year-history of dividend payments, evidencing stability, although the last dividend was cut or suspended in 2023.
| Factor | Detail |
|---|---|
| Sector | Hospitality & Leisure |
| Dividend Yield | 0.85% |
| Current Dividend per Share | 1.27 USD |
| Dividend History | 17 years |
| Last Cut or Suspension | 2023 |
Dividend History
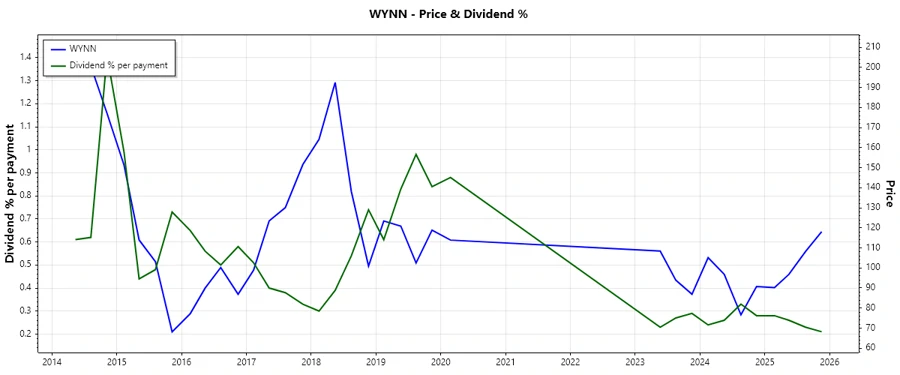
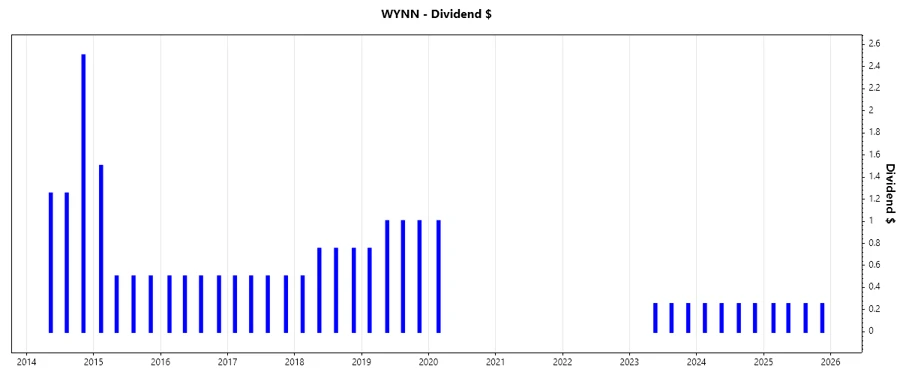
🗣️ The dividend history of Wynn Resorts reflects periods of both substantial returns and necessary fiscal restraint. Investors should note the recent reductions as indicators of broader market and operational challenges.
| Year | Dividend per Share (USD) |
|---|---|
| 2025 | 1.00 |
| 2024 | 1.00 |
| 2023 | 0.75 |
| 2020 | 1.00 |
| 2019 | 3.75 |
Dividend Growth
📈 An absence of growth over the past 3 to 5 years indicates a stabilization period possibly related to market conditions and internal capital allocation strategies.
| Time | Growth |
|---|---|
| 3 years | 0% |
| 5 years | 0% |
The average dividend growth is 0% over 5 years. This shows moderate but steady dividend growth.
Payout Ratio
⚠️ Payout ratios are critical in assessing the sustainability of dividend payments against earnings and cash flows. Wynn Resorts maintains a conservative EPS payout ratio of roughly 25.90%, showing a balance between payouts and retained earnings.
| Key Figure | Ratio |
|---|---|
| EPS-based | 25.90% |
| Free Cash Flow-based | 17.91% |
This conservative payout strategy allows Wynn Resorts to maintain financial flexibility, minimizing risks of dividend cuts in adverse market conditions.
Cashflow & Capital Efficiency
✅ Healthy cash flow and capital efficiency are vital in evaluating Wynn Resorts' capacity to cover operations and sustain dividend payouts. Their free cash flow yield and earnings yield display horizontal stability, providing a positive outlook for future dividends.
| Metric | 2024 | 2023 | 2022 |
|---|---|---|---|
| Free Cash Flow Yield | 10.59% | 7.22% | -4.52% |
| Earnings Yield | 5.29% | 7.12% | -4.52% |
| CAPEX to Operating Cash Flow | 29.63% | 40.64% | -494.59% |
| Stock-based Compensation to Revenue | 0.83% | 0.99% | 1.80% |
| Free Cash Flow / Operating Cash Flow Ratio | 70.37% | 59.36% | 594.59% |
The figures for 2024 suggest improvement in capital efficiency and cash flow stability, crucial for sustaining dividends and future growth.
Balance Sheet & Leverage Analysis
✅ A robust balance sheet can weather cyclical downturns. High leverage ratios reflect the typical capital-intensive nature of the hospitality industry, requiring vigilant management to prevent liquidity constraints.
| Metric | 2024 | 2023 | 2022 |
|---|---|---|---|
| Debt-to-Equity | -54.27 | -53.19 | -18.29 |
| Debt-to-Assets | 93.74% | 95.53% | 102.36% |
| Debt-to-Capital | 101.88% | 101.92% | 105.78% |
| Net Debt to EBITDA | 4.89 | 6.08 | 15.67 |
| Current Ratio | 1.90 | 1.93 | 2.22 |
| Quick Ratio | 1.85 | 1.89 | 2.19 |
| Financial Leverage | -57.90 | -55.68 | -17.87 |
The company exhibits high leverage, but with recent reductions in net debt to EBITDA, suggesting effective debt management.
Fundamental Strength & Profitability
🗣️ High profitability metrics reinforce shareholder value even through periods of operational volatility. Wynn Resorts demonstrates improvements in profitability margins despite sector challenges.
| Metric | 2024 | 2023 | 2022 |
|---|---|---|---|
| Return on Equity | -2.24% | -2.90% | 0.56% |
| Return on Assets | 3.86% | 5.22% | -3.16% |
| Net Profit Margin | 7.03% | 11.18% | -11.28% |
| Gross Profit Margin | 43.51% | 43.23% | 36.38% |
| EBIT Margin | 18.68% | 15.87% | -1.31% |
| EBITDA Margin | 27.93% | 26.40% | 17.12% |
| Research & Development to Revenue | 0% | 0% | 0% |
The marked improvement across profitability margins signals operational efficiency and a move towards sustainable growth.
Price Development
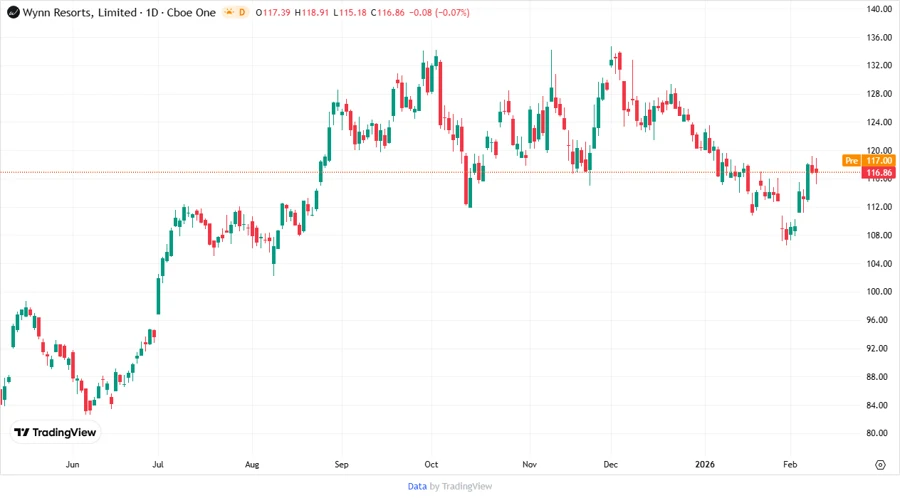
📉 The stock chart reflects the ongoing market perception and value assessment of Wynn Resorts, stabilizing its financial narrative despite external pressures.
Dividend Scoring System
| Criteria | Score | Visual |
|---|---|---|
| Dividend Yield | 2/5 | |
| Dividend Stability | 4/5 | |
| Dividend Growth | 1/5 | |
| Payout Ratio | 3/5 | |
| Financial Stability | 3/5 | |
| Dividend Continuity | 4/5 | |
| Cashflow Coverage | 3/5 | |
| Balance Sheet Quality | 2/5 |
Overall Score: 22/40
Rating
✅ Wynn Resorts, Limited merits a cautious yet positive outlook. While its dividend yield is modest, consistent stability and recent operational improvements highlight a robust potential for future shareholder returns. Investors should consider ongoing market conditions and financial metrics before making a commitment.