February 05, 2026 a 07:31 am

WYNN: Dividend Analysis - Wynn Resorts, Limited
Wynn Resorts, Limited, engaged in the hospitality and leisure industry, offers a modest dividend yield of 0.85%. Despite past fluctuations, the company's long-standing dividend history of 17 years highlights a sense of continuity and resilience in payouts, a positive sign for investors seeking incremental income. However, it's worth noting the recent dividend cut in 2023, necessitating close monitoring of future financial decisions.
📊 Overview
Wynn Resorts operates within the Entertainment sector, providing a dividend yield that barely hovers above 0.8%, reflective of its current economic positioning. With a current dividend per share of 1.27 USD, the company continues a legacy of dividend payments spanning 17 years. Recent challenges are evident with a suspension in 2023, marking a critical juncture in its dividend policy.
| Key Metric | Data |
|---|---|
| Sector | Entertainment |
| Dividend yield | 0.85% |
| Current dividend per share | 1.27 USD |
| Dividend history | 17 years |
| Last cut or suspension | 2023 |
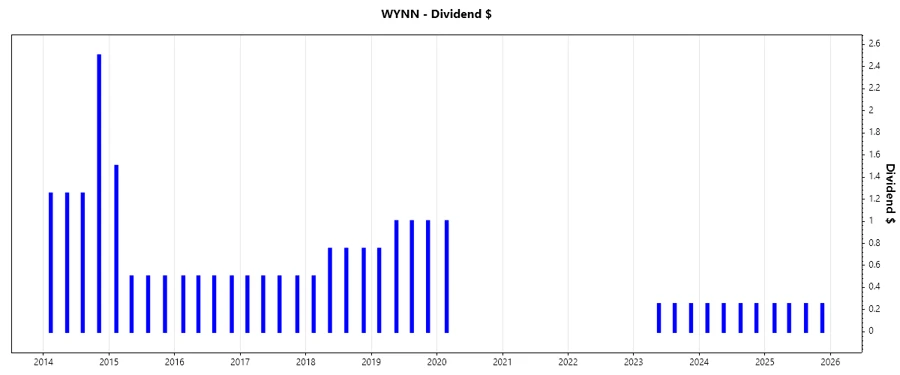
🗣️ Dividend History
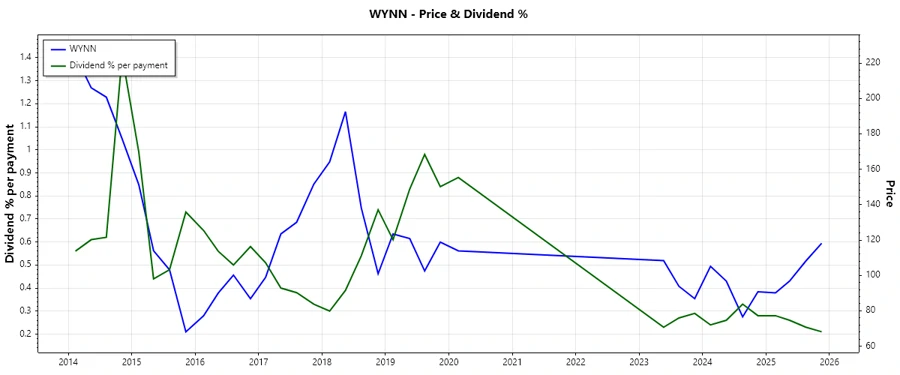
The narrative of Wynn's dividend history is one of resilience and adaptation. The consistency in payments over the years safeguards investor confidence, yet the recent suspension requires cautious optimism. Analyzing past trends ensures insights into future performances.
| Year | Dividend Per Share (USD) |
|---|---|
| 2025 | 1.00 |
| 2024 | 1.00 |
| 2023 | 0.75 |
| 2020 | 1.00 |
| 2019 | 3.75 |
📈 Dividend Growth
Without any visible growth in dividends over the past 3 or 5 years, investors must acknowledge potential limitations in earnings distribution. This stagnancy may reflect broader economic challenges or strategic preservations.
| Time Period | Growth |
|---|---|
| 3 years | 0% |
| 5 years | 0% |
The average dividend growth over the past 5 years is 0%, signifying stability rather than expansion, a sentiment mirrored by the static figures.
📉 Payout Ratio
Payout ratios serve as a crucial indicator of a company's commitment to its dividend strategy vis-à-vis its earnings. Wynn showcases an EPS-based payout ratio of 25.90%, while free cash flow-based stands at 17.91%, balanced metrics highlighting a cautious yet sustainable approach.
| Key Figure | Ratio |
|---|---|
| EPS-based | 25.90% |
| Free cash flow-based | 17.91% |
Wynn's prudent payout ratios suggest a mindful distribution policy, emphasizing fiscal responsibility without overextending its earnings.
✅ Cashflow & Capital Efficiency
Analyzing cash flow and capital efficiency offers insights into the operational soundness and future viability of dividend policies. Stability in cash flow signals robust fiscal health, pivotal in sustaining regular payouts.
| Metric | 2024 | 2023 | 2022 |
|---|---|---|---|
| Free Cash Flow Yield | 10.59% | 7.22% | -4.52% |
| Earnings Yield | 5.29% | 7.12% | -4.52% |
| CAPEX to Operating Cash Flow | 29.63% | 40.64% | -494.59% |
| Stock-based Compensation to Revenue | 0.83% | 0.99% | 1.80% |
| Free Cash Flow / Operating Cash Flow Ratio | 70.37% | 59.36% | 594.59% |
These metrics reveal Wynn's operational efficiency challenges yet underscore its strategic capital deployment, which is reflective in the fluctuating cash flow figures.
⚠️ Balance Sheet & Leverage Analysis
The balance sheet provides a holistic view of financial leverage and capital structure, key in assessing risk levels associated with debt financing, pivotal for dividend security.
| Metric | 2024 | 2023 | 2022 |
|---|---|---|---|
| Debt-to-Equity | -54.27% | -53.19% | -18.29% |
| Debt-to-Assets | 93.74% | 95.53% | 102.36% |
| Debt-to-Capital | 101.88% | 101.92% | 105.78% |
| Net Debt to EBITDA | 4.89 | 6.08 | 15.67 |
| Current Ratio | 1.90 | 1.93 | 2.22 |
| Quick Ratio | 1.85 | 1.89 | 2.19 |
| Financial Leverage | -57.90% | -55.68% | -17.87% |
The elevated leverage ratios and diminishing financial flexibility raise warnings about the underlying fiscal strategy requiring constant scrutiny to ensure dividend continuity.
✅ Fundamental Strength & Profitability
Profitability ratios serve as indicators of the operational effectiveness, guiding dividend distribution capabilities and assuring sustainable growth.
| Metric | 2024 | 2023 | 2022 |
|---|---|---|---|
| Return on Equity | -2.24% | -2.90% | 0.56% |
| Return on Assets | 0.04% | 0.05% | -0.03% |
| Margins: Net | 7.03% | 11.18% | -11.28% |
| Margins: EBIT | 18.68% | 15.87% | -1.31% |
| Margins: EBITDA | 27.93% | 26.40% | 17.12% |
| Margins: Gross | 43.51% | 43.22% | 36.38% |
| R&D to Revenue | 0% | 0% | 0% |
The marginal improvements in returns highlight operational resilience but also underline growth restrictions, emphasizing the need for strategic initiatives.
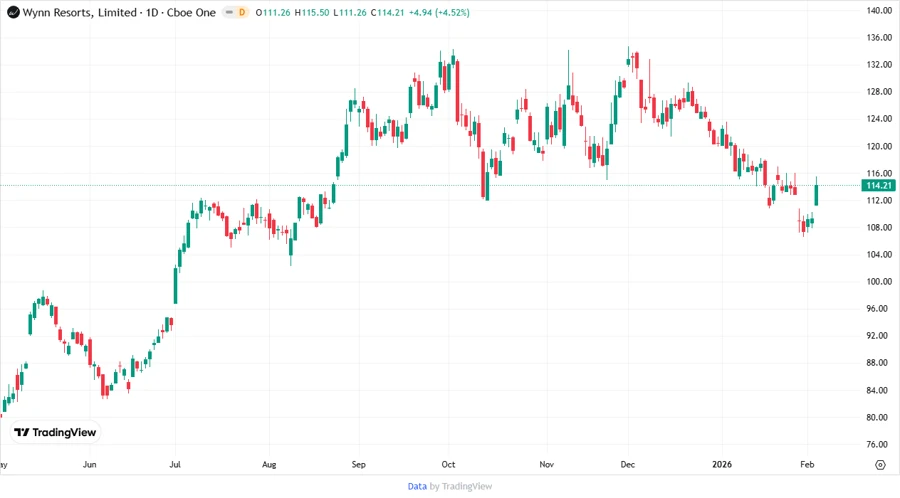
📈 Price Development
✅ Dividend Scoring System
| Criterion | Rating | Score |
|---|---|---|
| Dividend Yield | 1 | |
| Dividend Stability | 3 | |
| Dividend Growth | 1 | |
| Payout Ratio | 4 | |
| Financial Stability | 2 | |
| Dividend Continuity | 2 | |
| Cashflow Coverage | 3 | |
| Balance Sheet Quality | 2 |
Total Score: 18/40
💡 Rating
In conclusion, Wynn Resorts, Limited displays intrinsic strengths such as strong fiscal discipline as evidenced by healthy payout ratios. However, the lack of dividend growth and elevated leverage ratios present concerns. Given the moderate dividend stability and financial resilience, prospective investors should consider these factors and observe for future strategic improvements before undertaking positions aiming for dividend yield.