
July 18, 2026 a 03:15 pm
WTW: Fibonacci Analysis - Willis Towers Watson Public Limited Company
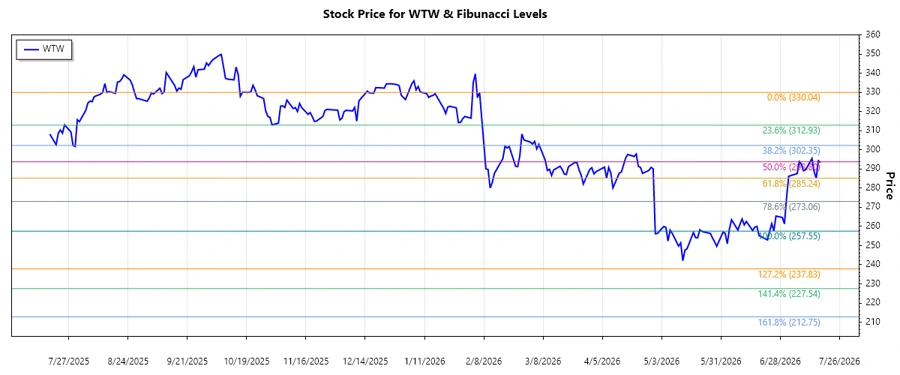
Willis Towers Watson (WTW) has showcased recent fluctuations in its stock performance, influencing investor sentiment. The firm provides diversified consulting and risk management services, positioning itself strategically within its industry. Currently, WTW is navigating through varying market conditions that could impact its key segments. The technical analysis reflects on nuanced patterns that might guide investors in decision-making. Overall, WTW remains a strong contender in consulting and insurance brokerage.
Fibonacci Analysis
| Criteria | Details | ||||||||||||
|---|---|---|---|---|---|---|---|---|---|---|---|---|---|
| Trend Start Date | 2026-02-06 | ||||||||||||
| Trend End Date | 2026-07-17 | ||||||||||||
| High Price | $330.04 on 2026-02-06 | ||||||||||||
| Low Price | $257.55 on 2026-06-23 | ||||||||||||
| Fibonacci Levels |
|
||||||||||||
| Current Price | $293.43 | ||||||||||||
| Retracement Zone | 0.5 (Possible Support) | ||||||||||||
| Technical Interpretation | The current price is at the 0.5 retracement level which could act as a potential support level if buyers come in strong. |
Conclusion
The technical analysis of Willis Towers Watson's stock reflects an ongoing potential consolidation phase near the 0.5 Fibonacci retracement level. While this could signal a short-term support, a decisive break either above or below this level would provide clearer insights. On the positive side, WTW's diversified service range bolsters its position amidst market challenges, indicating potential for long-term growth. However, risks persist given the volatile global economic conditions impacting client investments. Analysts should remain vigilant on macroeconomic indicators influencing client confidence. Future trends could pivot based on quarterly results, partnerships, or strategic expansions. Overall, while cautiously optimistic, investors should exercise due diligence supported by comprehensive market analysis.
Smart Data Insight
Master the Perfect Entry & Exit for this Stock
Don't leave your profits to chance. Historically, this stock follows specific seasonal patterns that institutional traders use to maximize returns.
- ✅ Identify the "Golden Buying Window"
- ✅ Avoid high-risk correction cycles
- ✅ Backtested data from the last 20+ years