June 30, 2026 a 03:30 am


WTW: Dividend Analysis - Willis Towers Watson Public Limited Company
Willis Towers Watson Public Limited Company (WTW) is a leading global advisory, broking, and solutions company. With a robust market capitalization of over $25 billion, WTW offers a blend of financial stability and moderate dividend growth, making it an appealing option for dividend-focused investors. Despite a relatively modest dividend yield, its long-standing dividend history and prudent payout ratios reflect the company's steadfast commitment to delivering value to shareholders.
📊 Overview
Willis Towers Watson operates in a dynamic sector that presents consistent growth opportunities. Here is a snapshot of its dividend profile:
| Metric | Value |
|---|---|
| Sector | Financial Services |
| Dividend Yield | 1.42% |
| Current Dividend Per Share | 3.65 USD |
| Dividend History | 24 years |
| Last Cut or Suspension | None |
📈 Dividend History
Understanding the dividend history is crucial as it reflects the company's commitment to returning earnings to shareholders. Here is the recent trend:
| Year | Dividend Per Share |
|---|---|
| 2026 | 1.92 USD |
| 2025 | 3.68 USD |
| 2024 | 3.52 USD |
| 2023 | 3.36 USD |
| 2022 | 3.28 USD |
🔍 Dividend Growth
Dividend growth is a significant indicator of financial health and shareholder returns. Here's how WTW's dividends grew over time:
| Time | Growth |
|---|---|
| 3 years | 3.91% |
| 5 years | 5.99% |
The average dividend growth is 5.99% over 5 years. This shows moderate but steady dividend growth, a positive indicator for long-term growth.
✅ Payout Ratio
Payout ratios indicate the sustainability of dividends relative to earnings and cash flow:
| Key Figure | Ratio |
|---|---|
| EPS-based | 20.86% |
| Free Cash Flow-based | 21.93% |
WTW maintains a conservative payout ratio, as evidenced by its 20.86% EPS and 21.93% FCF-based ratios, showcasing ample room for future payout increases.
💸 Cashflow & Capital Efficiency
Assessing cash flow and capital efficiency highlights a company's flexibility in managing its financial resources:
| Metric | 2025 | 2024 | 2023 |
|---|---|---|---|
| Free Cash Flow Yield | 4.80% | 3.97% | 4.36% |
| Earnings Yield | 4.98% | -0.31% | 4.17% |
| CAPEX to Operating Cash Flow | 12.61% | 16.20% | 17.99% |
| Stock-based Compensation to Revenue | 1.58% | 1.22% | 1.31% |
| Free Cash Flow / Operating Cash Flow Ratio | 87.10% | 83.80% | 82.00% |
The consistent free cash flow and efficient capital deployment underscore WTW's financial resilience and robust cash generation ability.
🗣️ Balance Sheet & Leverage Analysis
A thorough understanding of balance sheet strength is key in evaluating financial health and resilience:
| Metric | 2025 | 2024 | 2023 |
|---|---|---|---|
| Debt-to-Equity | 0.87 | 0.75 | 0.62 |
| Debt-to-Assets | 0.23 | 0.21 | 0.20 |
| Debt-to-Capital | 0.46 | 0.43 | 0.38 |
| Net Debt to EBITDA | 1.88 | 4.91 | 2.24 |
| Current Ratio | 1.20 | 1.20 | 1.06 |
| Quick Ratio | 1.20 | 1.20 | 1.06 |
| Financial Leverage | 3.70 | 3.49 | 3.06 |
WTW's leverage ratios indicate a balanced debt structure, with a declining Debt-to-Equity ratio, reflecting improving financial stability.
📉 Fundamental Strength & Profitability
The core financial strength indicators illustrate profitability and operational efficiency:
| Metric | 2025 | 2024 | 2023 |
|---|---|---|---|
| Return on Equity | 20.12% | -1.23% | 11.08% |
| Return on Assets | 5.44% | -0.35% | 3.63% |
| Margins: Net | 16.53% | -0.99% | 11.13% |
| EBIT | 23.25% | 3.70% | 15.97% |
| EBITDA | 27.55% | 8.29% | 21.29% |
| Gross | 42.06% | 44.59% | 43.65% |
| Research & Development to Revenue | 0% | 0% | 0% |
Strong profitability ratios, shown by the robust net profit and EBITDA margins, emphasize WTW's effective cost management and operational strength.
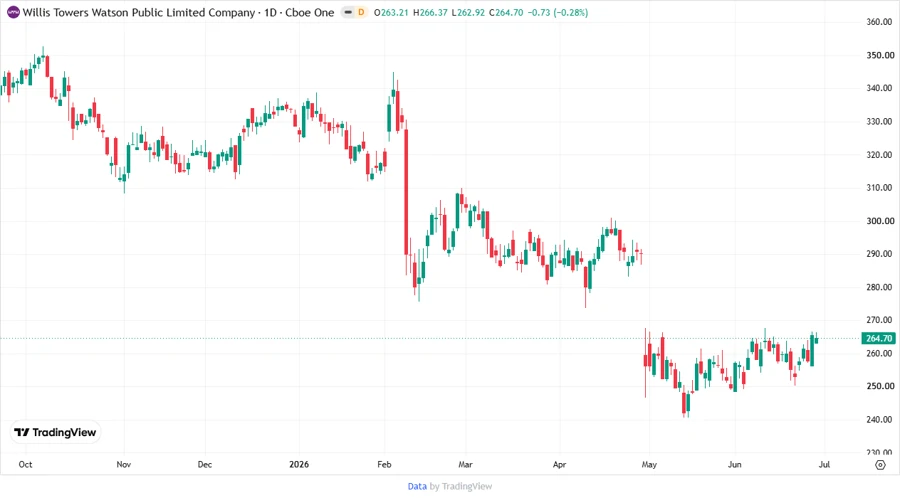
💹 Price Development
📏 Dividend Scoring System
| Criteria | Score | |
|---|---|---|
| Dividend Yield | 3 | |
| Dividend Stability | 5 | |
| Dividend Growth | 4 | |
| Payout Ratio | 5 | |
| Financial Stability | 4 | |
| Dividend Continuity | 5 | |
| Cashflow Coverage | 4 | |
| Balance Sheet Quality | 4 |
Total Score: 34/40
🏅 Rating
Willis Towers Watson achieves a high dividend score with strong financial fundamentals and stable growth in dividends. The company's prudent management of its payout ratios, supported by sound financial discipline, makes it an attractive choice for dividend investors looking for reliability and steady growth. This is a recommended investment for those emphasizing long-term dividend appreciation.
Smart Data Insight
Master the Perfect Entry & Exit for this Stock
Don't leave your profits to chance. Historically, this stock follows specific seasonal patterns that institutional traders use to maximize returns.
- ✅ Identify the "Golden Buying Window"
- ✅ Avoid high-risk correction cycles
- ✅ Backtested data from the last 20+ years