May 19, 2026 a 03:30 am


WTW: Dividend Analysis - Willis Towers Watson Public Limited Company
Willis Towers Watson (WTW) is a leading global advisory, broking, and solutions company that has displayed a stable dividend profile over many years. With a focus on providing value to shareholders, the company's dividend strategy reflects its commitment to consistent payout growth and financial stability. This analysis will delve into various aspects of WTW's dividend profile and financial health.
📊 Overview
Willis Towers Watson operates in the financial services sector with a remarkable record in maintaining consistent dividends. Currently offering a dividend yield of 1.28%, the company pays a dividend per share of 3.65 USD. With a long-standing history of 24 years of dividend payments, WTW has not had any cut or suspension recently, indicating a reliable track record.
| Attribute | Value |
|---|---|
| Sector | Financial Services |
| Dividend Yield | 1.28% |
| Current Dividend Per Share | 3.65 USD |
| Dividend History | 24 years |
| Last Cut or Suspension | None |
🗣️ Dividend History
Understanding the history of dividends is crucial in evaluating the reliability of a company's payout. WTW has steadily increased its dividends, with the latest five years reflecting a clear upward trajectory. This growth demonstrates WTW's commitment to rewarding shareholders through increasing returns.
| Year | Dividend Per Share (USD) |
|---|---|
| 2026 | 0.96 |
| 2025 | 3.68 |
| 2024 | 3.52 |
| 2023 | 3.36 |
| 2022 | 3.28 |
📈 Dividend Growth
WTW's dividend growth is a key highlight, showing moderate yet consistent increases over time. Over the past three years, the average growth rate has been approximately 3.91%. Extending to a five-year horizon, the growth becomes slightly more pronounced at 5.99%, reflecting WTW's strategic initiatives to enhance shareholder returns.
| Time | Growth |
|---|---|
| 3 years | 3.91% |
| 5 years | 5.99% |
The average dividend growth is 5.99% over 5 years. This shows moderate but steady dividend growth, confirming WTW’s focus on providing increasing returns to its shareholders.
⚠️ Payout Ratio
Payout Ratios for dividends provide insights into the sustainability of these payments relative to the company's earnings. WTW maintains a prudent payout policy with an EPS-based payout ratio of 20.86% and a Free Cash Flow (FCF)-based payout ratio of 21.93%. These ratios suggest that the dividends are well-covered by both profits and cash flows, allowing room for future dividend increases.
| Key figure | Ratio |
|---|---|
| EPS-based | 20.86% |
| Free cash flow-based | 21.93% |
The EPS-based ratio of 20.86% and FCF-based ratio of 21.93% denote a conservative payout strategy, ensuring dividend sustainability while preserving capital for growth and other investments.
📉 Cashflow & Capital Efficiency
Evaluating cash flow and capital efficiency is vital in understanding a company’s financial strength and its ability to support dividends. WTW's Free Cash Flow Yield is 6.48%, and the company exhibits good capital management with a CAPEX to Operating Cash Flow ratio of 12.61%. More strategically, the Free Cash Flow to Operating Cash Flow ratio stands at 87.10%, reflecting strong cash generation relative to operations.
| 2025 | 2024 | 2023 | |
|---|---|---|---|
| Free Cash Flow Yield | 4.80% | 3.97% | 4.36% |
| Earnings Yield | 4.98% | -0.31% | 4.17% |
| CAPEX to Operating Cash Flow | 12.90% | 16.20% | 17.99% |
| Stock-based Compensation to Revenue | 1.58% | 1.22% | 1.32% |
| Free Cash Flow / Operating Cash Flow Ratio | 87.10% | 83.80% | 82.00% |
| Return on Invested Capital | 11.52% | -3.49% | 6.59% |
The analysis of cash flows and capital efficiency confirms that WTW effectively utilizes its capital to generate healthy returns, ensuring ongoing capacity to support dividend obligations.
✅ Balance Sheet & Leverage Analysis
WTW exhibits a balanced leverage strategy, essential for assessing its long-term financial health. The debt-to-equity ratio is within a comfortable range, indicating reasonable levels of leverage. Other metrics, such as the quick ratio and interest coverage ratio, confirm strong liquidity and capacity to meet short-term obligations.
| 2025 | 2024 | 2023 | |
|---|---|---|---|
| Debt-to-Equity | 0.87 | 0.75 | 0.62 |
| Debt-to-Assets | 0.23 | 0.21 | 0.20 |
| Debt-to-Capital | 0.46 | 0.43 | 0.38 |
| Net Debt to EBITDA | 1.83 | 4.91 | 2.24 |
| Current Ratio | 1.20 | 1.20 | 1.06 |
| Quick Ratio | 1.20 | 1.20 | 1.06 |
| Financial Leverage | 3.70 | 3.49 | 3.06 |
WTW's leverage metrics are under control, ensuring sufficient flexibility for future investments and reducing financial risks associated with high leverage levels.
✅ Fundamental Strength & Profitability
Profitability ratios offer insights into the ability of Willis Towers Watson to generate profits from its resources. The return on equity and assets provides an indication of management effectiveness. Furthermore, WTW displays healthy gross and EBITDA margins, underscoring its operational efficiency.
| 2025 | 2024 | 2023 | |
|---|---|---|---|
| Return on Equity | 20.12% | -1.23% | 11.08% |
| Return on Assets | 5.44% | -0.35% | 3.63% |
| Net Margin | 16.53% | -0.99% | 11.13% |
| EBIT Margin | 23.25% | 3.70% | 15.97% |
| EBITDA Margin | 27.55% | 8.29% | 21.29% |
| Gross Margin | 42.06% | 44.59% | 43.65% |
| R&D to Revenue | 0% | 0% | 0% |
The strength and profitability of WTW are evident from its return metrics and margins, indicating its solid positioning in the industry for generating returns above the cost of capital.
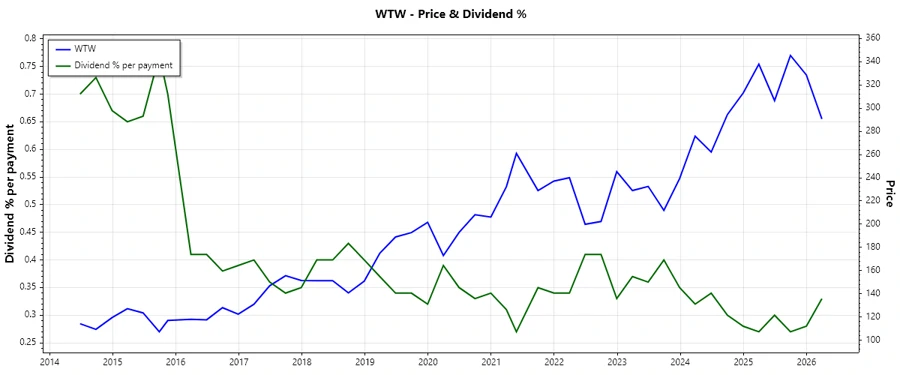
📈 Price Development
Dividend Scoring System
| Criteria | Score (/5) | Score Bar |
|---|---|---|
| Dividend Yield | 3 | |
| Dividend Stability | 5 | |
| Dividend Growth | 4 | |
| Payout Ratio | 5 | |
| Financial Stability | 4 | |
| Dividend Continuity | 5 | |
| Cashflow Coverage | 4 | |
| Balance Sheet Quality | 4 |
Total Score: 34/40
🏆 Rating
Willis Towers Watson is a robust dividend payer, evident from its historical commitment to dividends, moderate growth, and effective capital management. With a stable financial backbone, WTW is well-positioned to maintain and potentially enhance its dividend payouts, making it an attractive consideration for income-focused investors.
Smart Data Insight
Master the Perfect Entry & Exit for this Stock
Don't leave your profits to chance. Historically, this stock follows specific seasonal patterns that institutional traders use to maximize returns.
- ✅ Identify the "Golden Buying Window"
- ✅ Avoid high-risk correction cycles
- ✅ Backtested data from the last 20+ years