
March 13, 2026 a 03:31 pm

WTW: Dividend Analysis - Willis Towers Watson Public Limited Company
Willis Towers Watson Public Limited Company (WTW) presents a stable dividend profile with a long history of consistent payouts. Despite a moderate dividend yield, the company showcases reliability with 24 years of consistent dividend history. Its balanced payout ratios and steady growth in dividends reflect financial prudence, making it a solid option for dividend-focused investors.
📊 Overview
Willis Towers Watson, operating in the financial services sector, offers a dividend yield of 1.30%, with a current dividend per share of approximately 3.65 USD. The company has sustained its dividend history for 24 years, showcasing resilience and commitment to shareholders. The last cut or suspension was reported as "None", reinforcing confidence in its dividend strategy.
| Metric | Value |
|---|---|
| Sector | Financial Services |
| Dividend yield | 1.30% |
| Current dividend per share | 3.65 USD |
| Dividend history | 24 years |
| Last cut or suspension | None |
🗣️ Dividend History
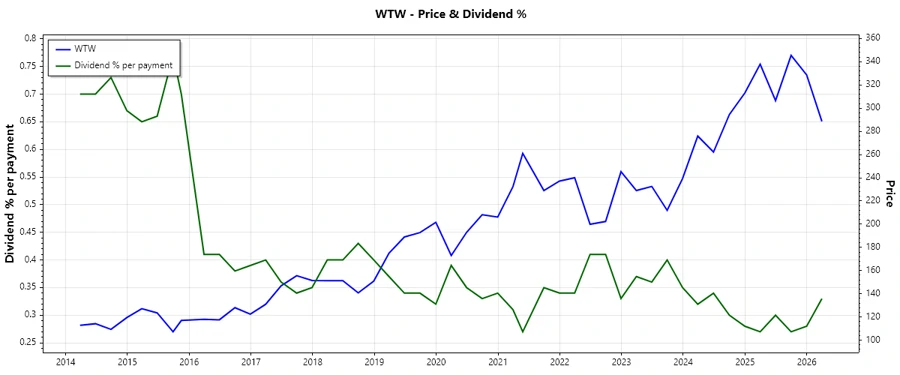
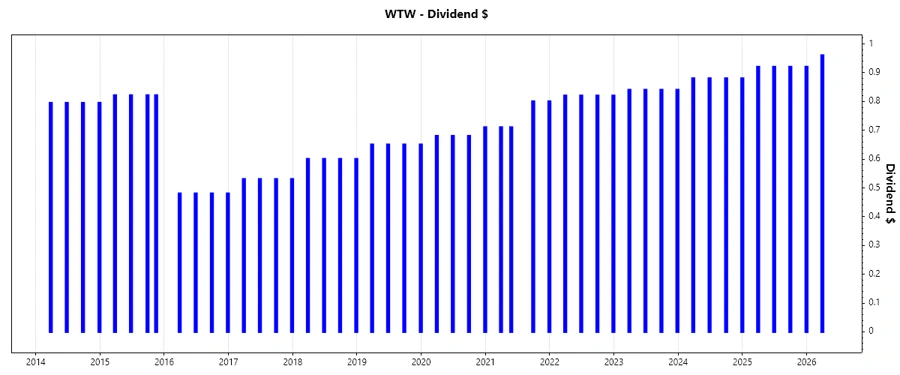
The dividend history of Willis Towers Watson is a testament to the company's ability to fulfill its dividend commitments. Over the past years, the consistent payouts and slight adjustments are indicative of a stable economic structure and cash flow capability, which are crucial for maintaining investor trust and interest.
| Year | Dividend per Share (USD) |
|---|---|
| 2026 | 0.96 |
| 2025 | 3.68 |
| 2024 | 3.52 |
| 2023 | 3.36 |
| 2022 | 3.28 |
📈 Dividend Growth
Dividend growth is a critical indicator of a company's capability to increase shareholder value over time. Over the past 3 and 5 years, WTW has exhibited a dividend growth rate of approximately 3.91% and 5.99%, respectively, underscoring a positive trend in return on shareholder equity.
| Time | Growth |
|---|---|
| 3 years | 3.91% |
| 5 years | 5.99% |
The average dividend growth is 5.99% over 5 years. This shows moderate but steady dividend growth, reinforcing shareholder value incrementally.
⚠️ Payout Ratio
The payout ratio provides insights into how much of the company’s earnings are being paid out as dividends. WTW's EPS-based payout ratio stands at 21.85%, while the free cash flow-based payout ratio is 22.54%. These modest figures suggest that WTW is efficiently managing its dividend relative to its earnings and cash flow.
| Key figure | Ratio |
|---|---|
| EPS-based | 21.85% |
| Free cash flow-based | 22.54% |
The payout ratios indicate that WTW is maintaining a conservative approach towards its dividend policy, keeping enough retained earnings to fuel future growth and provide investor confidence.
✅ Cashflow & Capital Efficiency
A robust cash flow is pivotal for sustaining dividends and funding growth. Analyzing the free cash flow yield, earnings yield, and various efficiency metrics reflect WTW's ability to effectively allocate resources and sustain operations.
| Year | 2023 | 2024 | 2025 |
|---|---|---|---|
| Free Cash Flow Yield | 4.36% | 3.97% | 4.80% |
| Earnings Yield | 4.17% | 4.98% | 4.98% |
| CAPEX to Operating Cash Flow | 17.99% | 16.20% | 12.56% |
| Stock-based Compensation to Revenue | 1.32% | 1.22% | 1.58% |
| Free Cash Flow / Operating Cash Flow Ratio | 82.01% | 83.80% | 87.10% |
The stability in cash flows and efficient capital allocation suggest WTW is strategically placed to support dividends and long-term operational sustainability.
🔍 Balance Sheet & Leverage Analysis
Leverage metrics, such as Debt-to-Equity and Net Debt to EBITDA, provide insights into the financial stability and risk exposure of the company. A balanced leverage ensures the company's ability to meet liabilities without compromising growth.
| Year | 2023 | 2024 | 2025 |
|---|---|---|---|
| Debt-to-Equity | 62.41% | 74.70% | 86.55% |
| Debt-to-Assets | 20.42% | 21.43% | 23.38% |
| Debt-to-Capital | 38.43% | 42.76% | 46.39% |
| Net Debt to EBITDA | 2.24 | 4.91 | 1.41 |
| Current Ratio | 1.06 | 1.20 | 1.20 |
| Quick Ratio | 1.06 | 1.20 | 1.20 |
| Financial Leverage | 3.06 | 3.49 | 3.70 |
WTW's balanced leverage strategy indicates solid financial positioning, enabling it to sustain operations while maintaining strategic growth flexibility.
📊 Fundamental Strength & Profitability
Fundamental strength and profitability metrics reflect the operational efficiency and profitability of WTW, providing insights into its performance and ability to generate returns for shareholders.
| Year | 2023 | 2024 | 2025 |
|---|---|---|---|
| Return on Equity | 11.08% | -1.23% | 20.12% |
| Return on Assets | 3.63% | -0.35% | 5.44% |
| Margins: Net | 11.13% | -0.99% | 16.53% |
| Margins: EBIT | 15.97% | 3.70% | 23.25% |
| Margins: EBITDA | 21.29% | 8.29% | 27.55% |
| Margins: Gross | 43.65% | 44.59% | 42.06% |
| Research & Development to Revenue | 0% | 0% | 0% |
WTW’s profitability metrics highlight robust performance with significant positive returns, manifesting the company's efficiency in revenue generation and cost management.
🔍 Price Development
📊 Dividend Scoring System
WTW is evaluated across multiple criteria, forming a comprehensive assessment of its dividend and financial health.
| Category | Score | |
|---|---|---|
| Dividend yield | 3 | |
| Dividend Stability | 5 | |
| Dividend growth | 4 | |
| Payout ratio | 5 | |
| Financial stability | 4 | |
| Dividend continuity | 5 | |
| Cashflow Coverage | 4 | |
| Balance Sheet Quality | 5 |
Total Score: 35/40
🏅 Rating
Overall, Willis Towers Watson demonstrates a commendable dividend strategy fortified by a strong balance sheet and prudent payout ratios. The company’s commitment to consistent dividend growth and financial stability make it a potentially rewarding option for dividend-focused investors seeking both income and the potential for capital appreciation.
Smart Data Insight
Master the Perfect Entry & Exit for this Stock
Don't leave your profits to chance. Historically, this stock follows specific seasonal patterns that institutional traders use to maximize returns.
- ✅ Identify the "Golden Buying Window"
- ✅ Avoid high-risk correction cycles
- ✅ Backtested data from the last 20+ years