December 24, 2025 a 11:31 am

WTW: Dividend Analysis - Willis Towers Watson Public Limited Company
Willis Towers Watson Public Limited Company exhibits a strong dividend profile, marked by a consistent dividend payout history, evident in its 23 consecutive years of dividends. With a current dividend yield of 1.11% and moderate growth rates in recent years, the company's dividends offer a stable, albeit not aggressive, income stream. The low payout ratios both from EPS and Free Cash Flow perspectives highlight sustainability and room for potential future increases.
📊 Overview
Analyzing Willis Towers Watson's sector positioning and dividend metrics provides key insights into its competitive stance and shareholder value proposition.
| Metric | Data |
|---|---|
| Sector | Insurance Brokerage |
| Dividend yield | 1.11 % |
| Current dividend per share | 3.47 USD |
| Dividend history | 23 years |
| Last cut or suspension | 2016 |
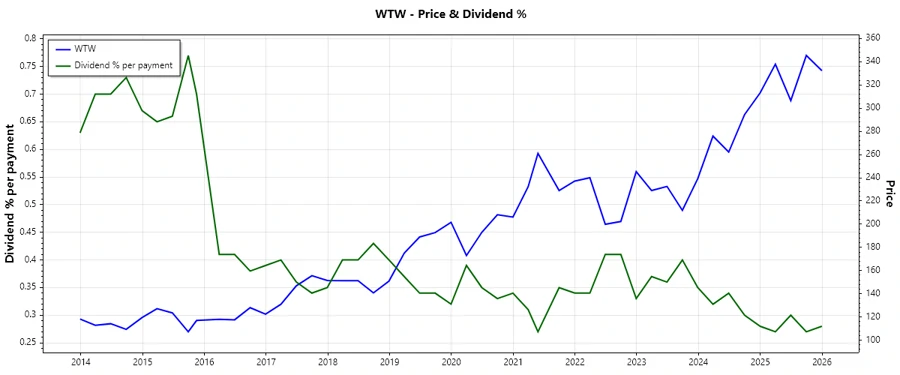
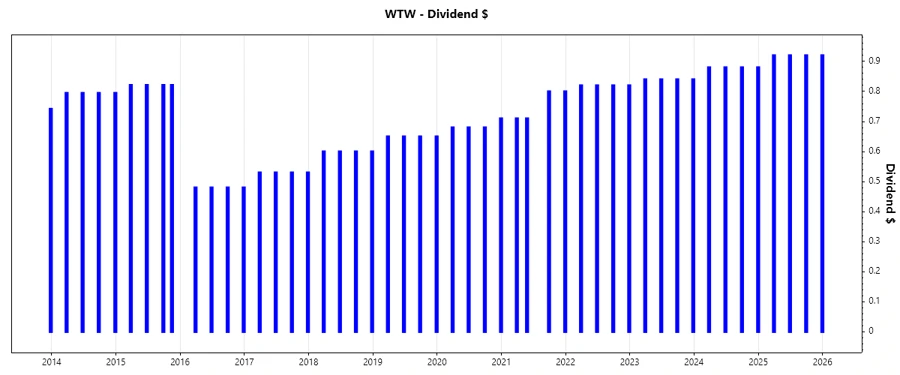
🗣️ Dividend History
The dividend history of Willis Towers Watson highlights the company's commitment to returning capital to shareholders, which is vital for investor relations and long-term trust.
| Year | Dividend per Share (USD) |
|---|---|
| 2025 | 3.68 |
| 2024 | 3.52 |
| 2023 | 3.36 |
| 2022 | 3.28 |
| 2021 | 3.02 |
📈 Dividend Growth
Dividend growth is a crucial indicator of a company's financial health and its commitment to enhancing shareholder value over time. Despite modest growth rates, the consistency suggests a well-managed policy aimed at sustainable growth.
| Time | Growth |
|---|---|
| 3 years | 5.24 % |
| 5 years | 6.25 % |
The average dividend growth is 6.25% over 5 years. This shows moderate but steady dividend growth.
📉 Payout Ratio
Payout ratios are a key measure of a company's dividend sustainability and ability to grow dividends. Low payout ratios provide leeway for future dividend increases and financial flexibility.
| Key figure ratio | |
|---|---|
| EPS-based | 16.24 % |
| Free cash flow-based | 21.83 % |
The EPS-based payout ratio of 16.24% and FCF-based payout ratio of 21.83% are prudent, indicating strong capacity for maintaining and potentially increasing dividends.
✅ Cashflow & Capital Efficiency
Cash Flow and capital efficiency metrics elucidate the firm's operational cash generation capabilities and investment allocation efficiency, which are critical for dividend sustainability.
| Year | 2024 | 2023 | 2022 |
|---|---|---|---|
| Free Cash Flow Yield | 3.97 % | 4.36 % | 2.22 % |
| Earnings Yield | -0.31 % | 4.17 % | 3.68 % |
| CAPEX to Operating Cash Flow | 16.20 % | 17.99 % | 25.12 % |
| Stock-based Compensation to Revenue | 1.22 % | 1.32 % | 1.12 % |
| Free Cash Flow / Operating Cash Flow Ratio | 83.80 % | 82.01 % | 74.88 % |
Overall, WTW demonstrates solid cash flow coverage and a disciplined capital efficiency, ensuring steady dividend support without overleveraging.
🚀 Balance Sheet & Leverage Analysis
Balance sheet metrics provide insights into financial health and risk, essential for assessing long-term dividend sustainability and potential growth.
| Year | 2024 | 2023 | 2022 |
|---|---|---|---|
| Debt-to-Equity | 0.75 | 0.62 | 0.55 |
| Debt-to-Assets | 21.43% | 20.42% | 17.25% |
| Debt-to-Capital | 42.76% | 38.43% | 35.36% |
| Net Debt to EBITDA | 4.91 | 2.24 | 2.24 |
| Current Ratio | 1.20 | 1.06 | 1.07 |
| Quick Ratio | 1.20 | 1.06 | 1.07 |
| Financial Leverage | 3.49 | 3.06 | 3.11 |
The leverage ratios reflect a manageable level of debt, aligning with benchmark levels and capable of supporting future growth initiatives.
💡 Fundamental Strength & Profitability
Fundamental measures like ROE and profit margins are pivotal to assess a company's intrinsic value and profitability, directly influencing dividend potential.
| Year | 2024 | 2023 | 2022 |
|---|---|---|---|
| Return on Equity | -1.23% | 11.08% | 10.07% |
| Return on Assets | -0.35% | 3.63% | 3.18% |
| Net Margin | -0.99% | 11.13% | 11.38% |
| EBIT Margin | 3.70% | 15.97% | 14.79% |
| EBITDA Margin | 8.29% | 21.29% | 21.18% |
| Gross Margin | 44.59% | 43.65% | 40.83% |
| R&D to Revenue | 0% | 0% | 0% |
The company exhibits robust profitability metrics, underscoring its efficiency in generating profit and maintaining cost-effectiveness, ensuring a reliable dividend payout capacity.
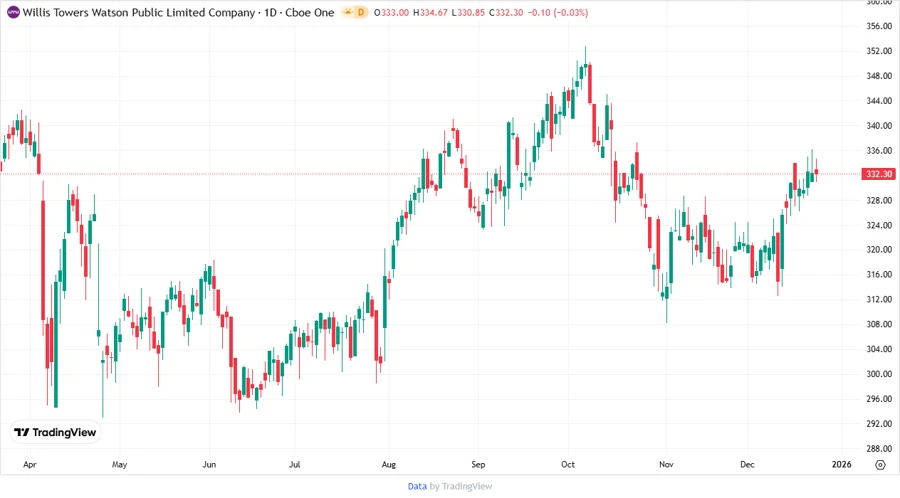
📉 Price Development
🏆 Dividend Scoring System
| Criteria | Details | Score |
|---|---|---|
| Dividend yield | 1.11% | 3 |
| Dividend Stability | 23 Years | 5 |
| Dividend Growth | 5 Year Growth: 6.25% | 4 |
| Payout Ratio | EPS: 16.24% | 4 |
| Financial Stability | Debt-to-Equity: 0.75 | 4 |
| Dividend Continuity | 2025: $3.68 | 5 |
| Cashflow Coverage | Free Cash Flow Yield: 3.97% | 3 |
| Balance Sheet Quality | Current Ratio: 1.20 | 4 |
Overall Score: 32/40
✅ Rating
Willis Towers Watson shows a solid dividend history and financial stability, reflecting a secure investment opportunity in dividend growth and consistent returns. Investors may find this company particularly attractive for its reliable payouts and low payout ratios, supplying confidence in sustained income.