November 25, 2025 a 07:31 am

WTW: Dividend Analysis - Willis Towers Watson Public Limited Company
Willis Towers Watson, a key player in the financial services industry, offers investors a consistent dividend profile with an impressive 23-year history of payments. Although the dividend yield of 1.05% is modest, the consistency suggests reliability. The company shows moderate growth with careful financial management, appealing to long-term dividend investors.
📊 Overview
Willis Towers Watson operates in the financial services sector. The company offers a reliable dividend profile with a yield of 1.05% and a current dividend of $3.47 per share. With a commitment to dividends for 23 consecutive years and no recent cuts or suspensions, the company underscores its commitment to rewarding shareholders.
| Sector | Dividend Yield (%) | Current Dividend per Share (USD) | Dividend History (Years) | Last Cut or Suspension |
|---|---|---|---|---|
| Financial Services | 1.05 | 3.47 | 23 | None |
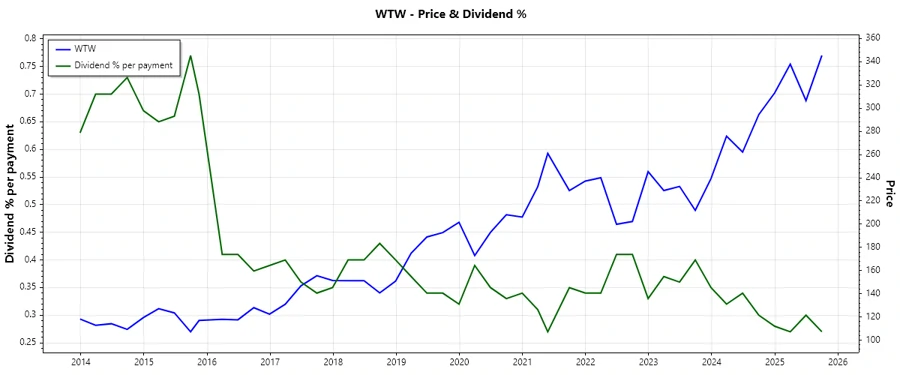
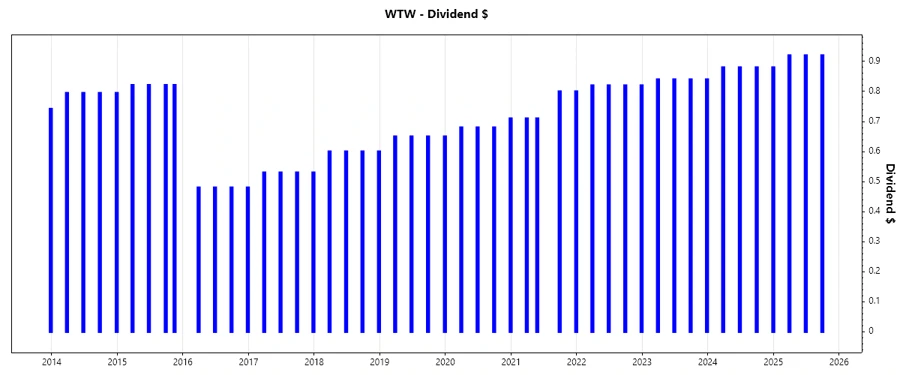
📈 Dividend History
The dividend history of Willis Towers Watson reflects consistency and stability, crucial virtues for income-focused investors. This history can help predict future performance and gauge the reliability of dividends.
| Year | Dividend per Share (USD) |
|---|---|
| 2025 | 2.76 |
| 2024 | 3.52 |
| 2023 | 3.36 |
| 2022 | 3.28 |
| 2021 | 3.02 |
📈 Dividend Growth
Dividend growth provides an insight into an organization's ability to increase shareholder value. With 5-year growth at 6.25%, Willis Towers Watson shows a steady, though modest, improvement in dividend payments.
| Time | Growth (%) |
|---|---|
| 3 years | 5.24 |
| 5 years | 6.25 |
The average dividend growth is 6.25% over 5 years. This shows moderate but steady dividend growth.
🗣️ Payout Ratio
Payout ratios indicate how much of the company's earnings are dedicated to dividends, impacting the sustainability of dividend payments. Willis Towers Watson exhibits a low EPS-based payout ratio of 16.24% and FCF-based at 21.83%, highlighting conservative financial practices that secure dividend reliability.
| Key figure | Ratio (%) |
|---|---|
| EPS-based | 16.24 |
| Free Cash Flow-based | 21.83 |
The low payout ratios suggest that Willis Towers Watson effectively manages its earnings and cash flows to maintain and potentially enhance dividend distributions.
📊 Cashflow & Capital Efficiency
Understanding a company's cashflow and capital efficiency is vital for evaluating dividend sustainability. High free cash flow can support dividend growth, even if earnings decline. The company's prudent capital management is reflected in its metrics such as a FCF to Operating Cash Flow Ratio of 83.80%.
| Year | 2022 | 2023 | 2024 |
|---|---|---|---|
| Free Cash Flow Yield | 2.22 | 4.36 | 3.96 |
| Earnings Yield | 3.68 | 4.17 | -0.31 |
| CAPEX to Operating Cash Flow | 25.12 | 17.99 | 16.20 |
| Stock-based Compensation to Revenue | 1.12 | 1.31 | 1.21 |
| Free Cash Flow / Operating Cash Flow Ratio | 74.88 | 82.00 | 83.80 |
The company exhibits strong capital efficiency, which bodes well for ongoing dividend payments and overall financial strength.
📊 Balance Sheet & Leverage Analysis
Analyzing the balance sheet and leverage provides insights into the company's financial health and risk associated with debt. Willis Towers Watson demonstrates moderate leverage with a Debt-to-Equity ratio of 0.75 as of the latest metrics. Maintaining manageable debt levels ensures flexibility in financial operations.
| Year | 2022 | 2023 | 2024 |
|---|---|---|---|
| Debt-to-Equity | 54.70 | 62.41 | 74.70 |
| Debt-to-Assets | 17.25 | 20.42 | 21.43 |
| Debt-to-Capital | 35.36 | 38.43 | 42.76 |
| Net Debt to EBITDA | 2.25 | 2.24 | 4.91 |
| Current Ratio | 1.071 | 1.064 | 1.199 |
| Quick Ratio | 1.071 | 1.064 | 1.199 |
| Financial Leverage | 3.17 | 3.05 | 3.49 |
With a stable balance sheet, Willis Towers Watson can sustain its dividend policy without jeopardizing its liquidity or financial stability.
📊 Fundamental Strength & Profitability
The examination of fundamental strength and profitability is crucial to understanding a company's ability to generate returns efficiently. The metrics of Return on Equity (ROE), Return on Assets (ROA), and margins highlight the operational efficiency and profitability of Willis Towers Watson.
| Year | 2022 | 2023 | 2024 |
|---|---|---|---|
| Return on Equity | 10.07 | 11.08 | -1.23 |
| Return on Assets | 3.18 | 3.63 | -0.35 |
| Margins: Net | 11.38 | 11.13 | -0.99 |
| Margins: EBIT | 14.79 | 15.97 | 3.70 |
| Margins: EBITDA | 21.18 | 21.29 | 8.29 |
| Margins: Gross | 40.83 | 43.65 | 44.59 |
| Research & Development to Revenue | 0.00 | 0.00 | 0.00 |
The company's operating efficiency, as reflected in its high gross and EBITDA margins, supports its sustained profit generation and financial strength.
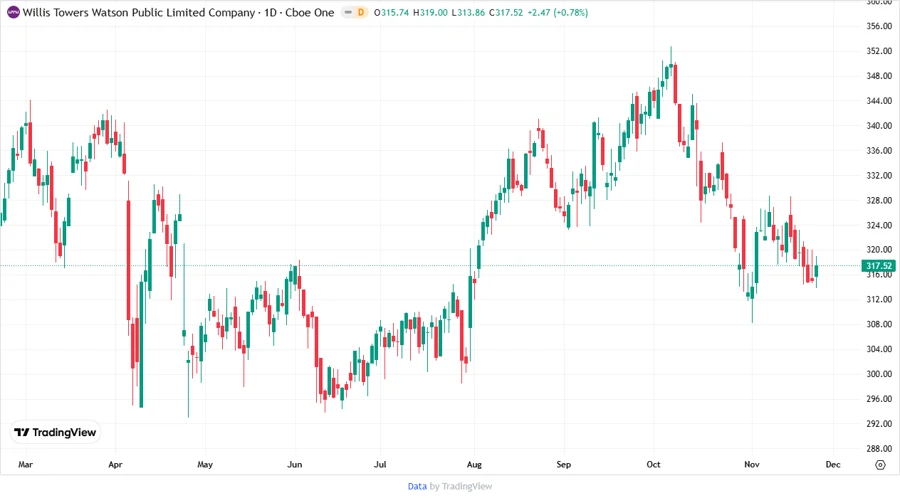
📉 Price Development
✅ Dividend Scoring System
| Criteria | Score | |
|---|---|---|
| Dividend yield | 3 | |
| Dividend Stability | 5 | |
| Dividend growth | 4 | |
| Payout ratio | 4 | |
| Financial stability | 4 | |
| Dividend continuity | 5 | |
| Cashflow Coverage | 4 | |
| Balance Sheet Quality | 4 |
Overall Score: 33/40
🗣️ Rating
Willis Towers Watson offers a robust and reliable dividend profile, appealing to conservative income investors due to its stability and growth in dividends. Its low payout ratio reassures sustainability, with financial stability supporting long-term strategic growth. This stock is a strong candidate for inclusion in a risk-averse, dividend-focused portfolio.