August 31, 2025 a 07:31 am


WTW: Dividend Analysis - Willis Towers Watson Public Limited Company
Willis Towers Watson is a leading player in the insurance and advisory industry, characterized by a stable dividend history, albeit with a high EPS payout ratio. Its recent performance suggests moderate growth potential, although the financials indicate a need for cautious optimism.
📊 Overview
The dividend profile of Willis Towers Watson showcases a mature company with consistent distribution, yet certain financial metrics demand scrutiny.
| Metric | Value |
|---|---|
| Sector | Insurance & Consulting |
| Dividend yield | 1.175% |
| Current dividend per share | 3.47 USD |
| Dividend history | 23 years |
| Last cut or suspension | None |
🗣️ Dividend History
With a dividend track record of 23 years, the consistency and reliability of payouts are vital markers of stability in shareholder returns.
| Year | Dividend per Share (USD) |
|---|---|
| 2025 | 1.84 |
| 2024 | 3.52 |
| 2023 | 3.36 |
| 2022 | 3.28 |
| 2021 | 3.02 |
📈 Dividend Growth
Dividend growth provides insights into the company's capacity to increase shareholder returns over time. With modest growth, WTW has retained its dividend policies.
| Time | Growth |
|---|---|
| 3 years | 5.24% |
| 5 years | 6.25% |
The average dividend growth is 6.25% over 5 years. This shows moderate but steady dividend growth.
⚠️ Payout Ratio
Analyzing payout ratios, particularly EPS and FCF-based, can prevent over-distribution risk and highlight fiscal prudence.
| Key figure | Ratio |
|---|---|
| EPS-based | 253.33% |
| Free cash flow-based | 26.43% |
The EPS payout reflects significant over-distribution, suggesting potential vulnerability, whereas FCF-based ratio remains manageable.
✅ Cashflow & Capital Efficiency
Cash flow health and capital efficiency are vital to ensure sustainable operations and dividend payments.
| Year | 2024 | 2023 | 2022 |
|---|---|---|---|
| Free Cash Flow Yield | 3.97% | 4.36% | 2.22% |
| Earnings Yield | -0.31% | 4.17% | 3.68% |
| CAPEX to Operating Cash Flow | 16.2% | 17.99% | 25.12% |
| Stock-based Compensation to Revenue | 1.22% | 1.32% | 1.12% |
| Free Cash Flow / Operating Cash Flow Ratio | 0.84 | 0.82 | 0.75 |
The cash flow metrics suggest decent capital efficiency and resource utilization, ensuring stable investment flow.
📉 Balance Sheet & Leverage Analysis
A sturdy balance sheet furthers fiscal reliability; leverage decisions impact long-term stability.
| Year | 2024 | 2023 | 2022 |
|---|---|---|---|
| Debt-to-Equity | 0.75 | 0.62 | 0.55 |
| Debt-to-Assets | 0.21 | 0.20 | 0.17 |
| Debt-to-Capital | 0.43 | 0.38 | 0.35 |
| Net Debt to EBITDA | 4.91 | 2.24 | 2.25 |
| Current Ratio | 1.20 | 1.06 | 1.07 |
| Quick Ratio | 1.20 | 1.06 | 1.07 |
| Financial Leverage | 3.49 | 3.06 | 3.17 |
The leverage figures reveal an improving debt management trend, enhancing financial stability over the observed period.
🔍 Fundamental Strength & Profitability
Profitability ratios depict the firm's ability to generate earnings relative to revenue, equity, and assets.
| Year | 2024 | 2023 | 2022 |
|---|---|---|---|
| Return on Equity | -1.23% | 11.08% | 10.07% |
| Return on Assets | -0.35% | 3.63% | 3.18% |
| Margins: Net | -0.99% | 11.13% | 11.38% |
| EBIT | 3.70% | 15.97% | 14.79% |
| EBITDA | 8.29% | 21.29% | 21.18% |
| Gross | 44.59% | 43.65% | 40.83% |
| Research & Development to Revenue | 0 | 0 | 0 |
The company’s profitability metrics reflect robust margin capabilities, although recent drops in specific areas warrant attention.
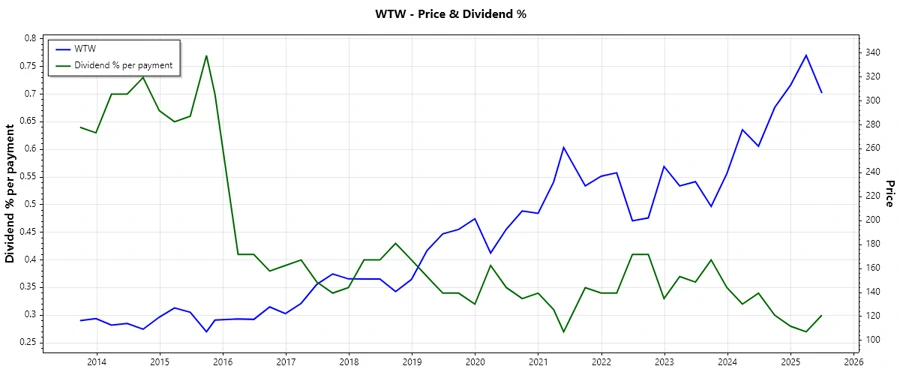
📈 Price Development
🔢 Dividend Scoring System
| Category | Score | Visual |
|---|---|---|
| Dividend yield | 2 | |
| Dividend Stability | 4 | |
| Dividend growth | 3 | |
| Payout ratio | 1 | |
| Financial stability | 3 | |
| Dividend continuity | 4 | |
| Cashflow Coverage | 3 | |
| Balance Sheet Quality | 3 |
Overall Score: 23/40
💼 Rating
Given the detailed analysis, Willis Towers Watson receives a mixed rating. While its dividend stability and continuity remain commendable, the current payout ratio and marginal growth metrics call for prudence. Investors should weigh the stable returns against potential growth limitations in their decisions.