August 04, 2025 a 02:46 am


WTW: Dividend Analysis - Willis Towers Watson Public Limited Company
Willis Towers Watson is a prominent player in the insurance broking and advisory industry. With a substantial market presence, their consistent dividend payments highlight a commitment to shareholder returns. However, challenges in maintaining a robust payout ratio amidst fluctuating free cash flows suggest a need for prudent financial management. Their commitment to increasing dividend payments over the years portrays a positive outlook to investors.
📊 Overview
Willis Towers Watson has a diversified presence across financial services, primarily in the insurance sector. Their relatively low dividend yield of 1.17% shows a conservative approach to dividend distribution. The company has an impressive dividend history of 23 years demonstrating stability, with no recent cuts or suspensions.
| Sector | Dividend Yield (%) | Current Dividend per Share (USD) | Dividend History (years) | Last Cut or Suspension |
|---|---|---|---|---|
| Financial Services | 1.17 | 3.47 | 23 | None |
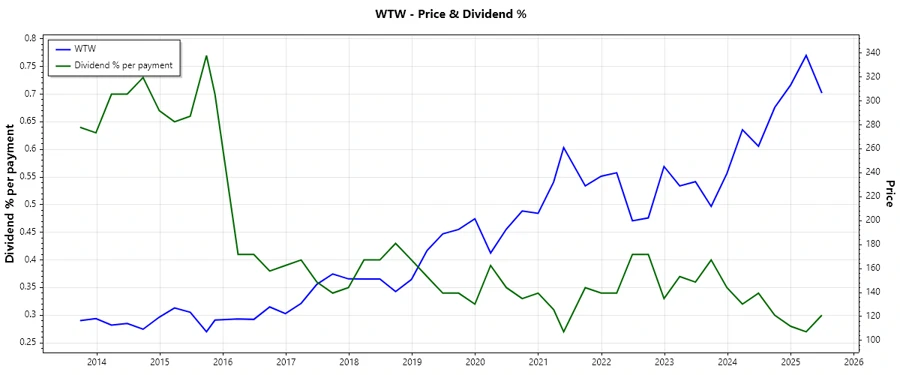
🗣️ Dividend History
The historical performance of dividends is a crucial measure of reliability and investor confidence. Willis Towers Watson's consistent dividend payments highlight their commitment, with incremental increases aligning to financial growth strategies.
| Year | Dividend per Share (USD) |
|---|---|
| 2025 | 1.84 |
| 2024 | 3.52 |
| 2023 | 3.36 |
| 2022 | 3.28 |
| 2021 | 3.02 |
📈 Dividend Growth
Examining growth trends helps evaluate future dividend potential. A three-year growth rate of 5.24% suggests a moderate increase, while a five-year growth rate of 6.25% indicates ongoing commitment to enhance shareholder value.
| Time | Growth (%) |
|---|---|
| 3 Years | 5.24 |
| 5 Years | 6.25 |
The average dividend growth is 6.25% over 5 years. This shows moderate but steady dividend growth.
✅ Payout Ratio
Payout ratios are essential to determine the sustainability of dividends. A high EPS-based payout ratio of 253.33% raises sustainability concerns of current payout levels, though a reasonable FCF-based ratio of 25.83% alleviates immediate pressure.
| Key Figure | Ratio (%) |
|---|---|
| EPS-based | 253.33 |
| Free Cash Flow-based | 25.83 |
The disparity between the EPS and FCF-based ratios could signify potential profitability issues and indicates the necessity for thorough fiscal oversight.
📊 Cashflow & Capital Efficiency
Robust cash flow management highlights the company's capability to maintain dividends. Evaluating metrics like Free Cash Flow Yield and CAPEX efficiency elucidates the firm’s financial prudence.
| Metric | 2024 | 2023 | 2022 |
|---|---|---|---|
| Free Cash Flow Yield | 3.97% | 4.36% | 2.22% |
| Earnings Yield | -0.31% | 4.17% | 3.68% |
| CAPEX to Operating Cash Flow | 16.20% | 17.99% | 25.12% |
| Stock-based Compensation to Revenue | 1.22% | 1.31% | 1.12% |
| Free Cash Flow / Operating Cash Flow Ratio | 83.80% | 82.00% | 74.88% |
Analyzing the cash flow and capital expenditure ratios exhibits stability of operations whereas efficiency in capital allocation underpins better long-term returns.
⚠️ Balance Sheet & Leverage Analysis
The assessment of the balance sheet and leverage ratios informs on liquidity and solvency positions. Stable debt ratios indicate a prudent debt management strategy vis-à-vis returns.
| Metric | 2024 | 2023 | 2022 |
|---|---|---|---|
| Debt-to-Equity Ratio | 74.70% | 62.40% | 54.58% |
| Debt-to-Assets Ratio | 21.43% | 20.42% | 17.21% |
| Debt-to-Capital Ratio | 42.76% | 38.42% | 35.31% |
| Net Debt to EBITDA | 4.91 | 2.24 | 2.24 |
| Current Ratio | 1.12 | 1.06 | 1.07 |
| Quick Ratio | 1.20 | 1.06 | 1.07 |
The company’s leverage ratios are within industry norms, indicating balanced debt levels supporting financial flexibility.
🔍 Fundamental Strength & Profitability
Profitability ratios such as Return on Equity and Asset Margins offer insights into operational efficiency and profitability sustainability.
| Metric | 2024 | 2023 | 2022 |
|---|---|---|---|
| Return on Equity | -1.23% | 11.08% | 10.07% |
| Return on Assets | -0.35% | 3.63% | 3.18% |
| Net Profit Margin | -0.98% | 11.12% | 11.38% |
| EBIT Margin | 3.70% | 15.97% | 16.54% |
| EBITDA Margin | 8.29% | 21.29% | 21.18% |
Despite downturns in 2024, previous years show robust performance. Maintaining these margins is crucial for future dividend sustainability.
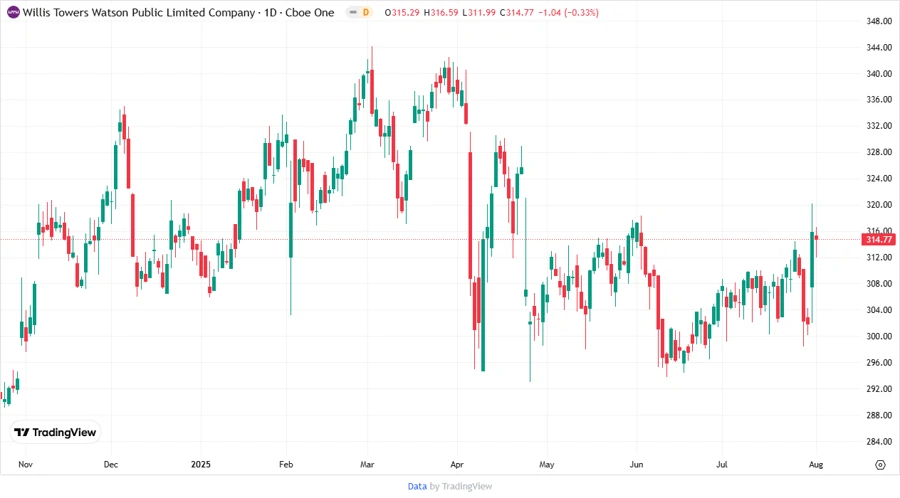
📉 Price Development
🔄 Dividend Scoring System
| Category | Score (1-5) | Score Bar |
|---|---|---|
| Dividend Yield | 2 | |
| Dividend Stability | 4 | |
| Dividend Growth | 3 | |
| Payout Ratio | 3 | |
| Financial Stability | 4 | |
| Dividend Continuity | 5 | |
| Cashflow Coverage | 3 | |
| Balance Sheet Quality | 4 |
Total Score: 28/40
📝 Rating
Overall, Willis Towers Watson showcases a respectable dividend track record, albeit with some concerns over payout sustainability. Their growth and continuity prospects remain promising, meriting a cautiously optimistic investment consideration.
Smart Data Insight
Master the Perfect Entry & Exit for this Stock
Don't leave your profits to chance. Historically, this stock follows specific seasonal patterns that institutional traders use to maximize returns.
- ✅ Identify the "Golden Buying Window"
- ✅ Avoid high-risk correction cycles
- ✅ Backtested data from the last 20+ years