June 02, 2025 a 07:46 am


📊 WTW: Dividend Analysis - Willis Towers Watson Public Limited Company
Willis Towers Watson demonstrates a complex dividend profile with moderate growth and a notable payout history. Despite its strong market presence, the company's payout ratios and financial ratios point toward inconsistencies that merit investor caution. This analysis delves into various financial aspects to provide clarity on its dividend viability and overall financial health.
Overview
🗣️ As a prominent player in the financial services sector, Willis Towers Watson boasts a substantial dividend yield, reflecting its commitment to shareholder returns. With over two decades of dividend history, the company exemplifies stability in payouts. However, it is crucial to monitor recent dividend cuts or suspensions, even if currently absent.
| Criteria | Details |
|---|---|
| Sector | Financial Services |
| Dividend yield | 1.1373 % |
| Current dividend per share | 3.47 USD |
| Dividend history | 23 years |
| Last cut or suspension | None |
Dividend History
📉 Examining the dividend history, the company has demonstrated a consistent payment pattern, albeit with variations in growth. Understanding this history is vital in assessing potential future payouts and determining long-term investment viability.
| Year | Dividend per Share |
|---|---|
| 2025 | 1.84 USD |
| 2024 | 3.52 USD |
| 2023 | 3.36 USD |
| 2022 | 3.28 USD |
| 2021 | 3.02 USD |
Dividend Growth
📈 The growth of dividends over the past few years offers insights into the company's strategic directives and sustainability of returns. With a moderate but stable growth rate, this segment provides essential indicators for future expectations.
| Time | Growth |
|---|---|
| 3 years | 5.24 % |
| 5 years | 6.25 % |
The average dividend growth is 6.25 % over 5 years. This shows moderate but steady dividend growth.
Payout Ratio
⚠️ The payout ratio indicates how well earnings support dividends, a crucial measure of dividend sustainability. The current ratios suggest a high level of leverage, impacting dividend payout capabilities and potentially signaling risk to investors.
| Key Figure | Ratio |
|---|---|
| EPS-based | -654.83 % |
| Free cash flow-based | 24.70 % |
These figures indicate a concerning alignment between profitability and dividend payouts, particularly the negative EPS-based payout ratio, underscoring potential sustainability issues for dividends.
Cashflow & Capital Efficiency
✅ A company's cash flow measures its ability to sustain operations and fund dividend payments. This section evaluates crucial liquidity metrics and capital efficiency ratios, providing investors with a comprehensive overview of financial health.
| Metric | 2024 | 2023 | 2022 |
|---|---|---|---|
| Free Cash Flow Yield | 3.97 % | 4.36 % | 2.22 % |
| Earnings Yield | -0.31 % | 4.17 % | 3.68 % |
| CAPEX to Operating Cash Flow | 16.20 % | 17.99 % | 25.12 % |
| Stock-based Compensation to Revenue | 1.22 % | 1.32 % | 1.12 % |
| Free Cash Flow / Operating Cash Flow Ratio | 83.80 % | 82.00 % | 74.88 % |
These ratios underline the company's ability to convert revenues into cash available for dividends. A decreasing trend in capital efficiency may require corrective strategic measures.
Balance Sheet & Leverage Analysis
🛠️ Understanding a company's leverage and financial stability is vital for assessing its long-term viability. This section breaks down the debt composition and coverage ratios to evaluate financial health and flexibility.
| Metric | 2024 | 2023 | 2022 |
|---|---|---|---|
| Debt-to-Equity | 0.75 | 0.62 | 0.55 |
| Debt-to-Assets | 0.21 | 0.20 | 0.17 |
| Debt-to-Capital | 0.43 | 0.38 | 0.35 |
| Net Debt to EBITDA | 6.44 | 2.24 | 2.24 |
| Current Ratio | 1.20 | 1.06 | 1.07 |
| Quick Ratio | 1.20 | 1.05 | 1.07 |
| Financial Leverage | 3.49 | 3.06 | 3.17 |
The balance sheet reflects considerable leverage, with the Debt-to-Equity ratio elevated over recent years. This necessitates prudent debt management strategies to safeguard financial flexibility.
Fundamental Strength & Profitability
🏛️ Analyzing profitability ratios is imperative for evaluating how well a company converts revenue into profits. Here, key profitability indicators provide a snapshot of operational efficiency and effectiveness.
| Metric | 2024 | 2023 | 2022 |
|---|---|---|---|
| Return on Equity | -1.23 % | 11.08 % | 10.07 % |
| Return on Assets | -0.35 % | 3.63 % | 3.18 % |
| Net Margin | -0.99 % | 11.13 % | 11.38 % |
| EBIT Margin | 3.70 % | 15.97 % | 16.54 % |
| EBITDA Margin | 6.31 % | 21.29 % | 21.18 % |
| Gross Margin | 44.59 % | 43.65 % | 40.83 % |
The fundamental analysis reveals significant volatility in profitability, warranting a reevaluation of strategic priorities to enhance and stabilize profit margins.
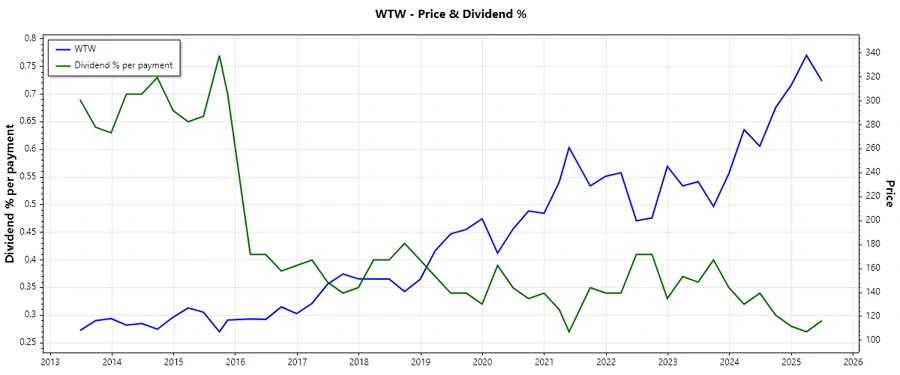
Price Development
Dividend Scoring System
The Dividend Scoring System evaluates essential criteria to offer a comprehensive dividend health check. This system rates each category, providing insights into the company's dividend robustness.
| Category | Score | Indicator |
|---|---|---|
| Dividend yield | 2 | |
| Dividend Stability | 4 | |
| Dividend growth | 3 | |
| Payout ratio | 1 | |
| Financial stability | 2 | |
| Dividend continuity | 5 | |
| Cashflow Coverage | 3 | |
| Balance Sheet Quality | 2 |
Overall Score: 22/40
Rating
The analysis concludes with a cautionary stance towards Willis Towers Watson's dividend profile. While its history and continuity commend stability, concerns around payout ratios and profitability necessitate close monitoring. Investors should weigh current and potential risks against dividend payouts and overall financial health before making investment decisions.
Smart Data Insight
Master the Perfect Entry & Exit for this Stock
Don't leave your profits to chance. Historically, this stock follows specific seasonal patterns that institutional traders use to maximize returns.
- ✅ Identify the "Golden Buying Window"
- ✅ Avoid high-risk correction cycles
- ✅ Backtested data from the last 20+ years