January 18, 2026 a 07:31 am


WST: Dividend Analysis - West Pharmaceutical Services, Inc.
In an era of market volatility, West Pharmaceutical Services, Inc. demonstrates a strong commitment to its shareholders with a steady dividend history. Equipped with a low payout ratio and an admirable history of 40 consecutive years without dividend cuts, the company presents itself as a resilient choice for dividend-focused investors. Although the current dividend yield is modest, consistent dividend growth underscores the company’s financial health and capacity to sustain payouts.
Overview 📊
West Pharmaceutical Services, Inc. operates within the healthcare equipment sector, making significant contributions through its steadfast dividend policy. The company currently offers a dividend yield of 0.33%, supported by a dividend per share of 0.81 USD. Notably, the company has maintained a dividend history for 40 consecutive years, with no recent cuts or suspensions.
| Metric | Details |
|---|---|
| Sector | Healthcare Equipment |
| Dividend yield | 0.33% |
| Current dividend per share | 0.81 USD |
| Dividend history | 40 years |
| Last cut or suspension | None |
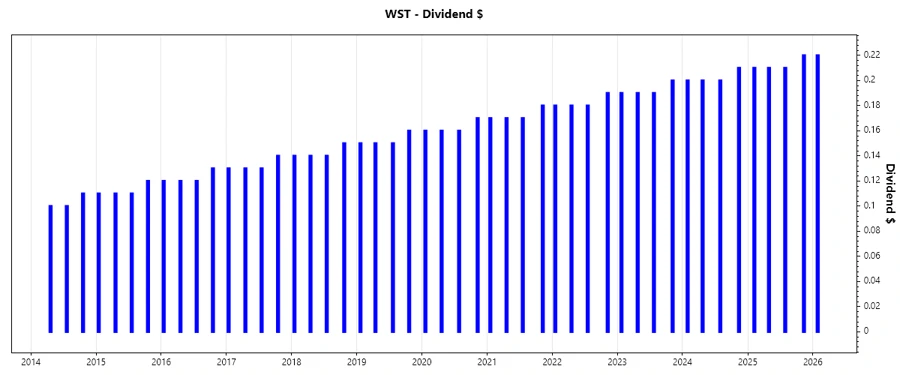
Dividend History 🗣️
The evolution of West Pharmaceutical Services' dividend payments reflects its progressive shareholder value approach. An admirable track record of 40 years illustrates uninterrupted commitment to consistent payouts, weathering various economic cycles. Such continuity attracts both income-focused investors and those seeking stable returns over time.
| Year | Dividend Per Share (USD) |
|---|---|
| 2026 | 0.22 |
| 2025 | 0.85 |
| 2024 | 0.81 |
| 2023 | 0.77 |
| 2022 | 0.73 |
Dividend Growth 📈
Steady and modest growth defines West Pharmaceutical Services' dividend strategy. This is particularly evident in their consistent increases over the past three and five years.
| Time | Growth |
|---|---|
| 3 years | 5.2% |
| 5 years | 5.5% |
The average dividend growth is 5.5% over 5 years. This shows moderate but steady dividend growth, beneficial for investors looking for incremental income increases.
Payout Ratio 📉
The payout ratio is a critical factor in assessing dividend sustainability. West Pharmaceutical Services keeps its payout ratio at manageable levels, ensuring dividends are well-covered by earnings and cash flow.
| Key Figure | Ratio |
|---|---|
| EPS-based | 11.90% |
| Free cash flow-based | 15.36% |
Both EPS and FCF payout ratios highlight a conservative approach, allowing ample room for reinvestment and innovation while safeguarding shareholder returns.
Cashflow & Capital Efficiency ✅
Analyzing cash flow and capital efficiency provides insights into the company’s operational prowess and resource optimization. These factors affect the ability to finance dividends sustainably.
| Year | 2022 | 2023 | 2024 |
|---|---|---|---|
| Free Cash Flow Yield | 2.51% | 1.58% | 1.16% |
| Earnings Yield | 3.35% | 2.27% | 2.06% |
| CAPEX to Operating Cash Flow | 39.31% | 46.62% | 57.70% |
| Stock-based Compensation to Revenue | 0.82% | 0.79% | 0.65% |
| Free Cash Flow / Operating Cash Flow Ratio | 60.69% | 53.38% | 42.30% |
West Pharmaceutical highlights sound cash management and capital efficiency, supporting its resilience in providing steady dividends while also investing in growth initiatives.
Balance Sheet & Leverage Analysis ⚠️
Understanding leverage and liquidity ratios helps assess the company's financial stability and its ability to meet obligations, crucial for long-term dividend reliability.
| Year | 2022 | 2023 | 2024 |
|---|---|---|---|
| Debt-to-Equity | 0.118 | 0.107 | 0.114 |
| Debt-to-Assets | 0.088 | 0.081 | 0.084 |
| Debt-to-Capital | 0.106 | 0.097 | 0.102 |
| Net Debt to EBITDA | -0.713 | -0.646 | -0.241 |
| Current Ratio | 3.698 | 2.882 | 2.794 |
| Quick Ratio | 2.899 | 2.235 | 2.110 |
| Financial Leverage | 1.347 | 1.329 | 1.358 |
The company's leverage metrics display prudent financial management, ensuring sufficient liquidity to uphold its dividend policy successfully.
Fundamental Strength & Profitability 📏
Rigorously analyzing profitability and operational metrics showcases the fundamental strength and efficiency of the company, directly impacting its dividend capacity.
| Year | 2022 | 2023 | 2024 |
|---|---|---|---|
| Return on Equity | 21.82% | 20.60% | 18.37% |
| Return on Assets | 16.20% | 15.50% | 13.52% |
| Margins: Net | 20.31% | 20.11% | 17.03% |
| EBIT | 23.83% | 23.95% | 20.34% |
| EBITDA | 28.01% | 28.60% | 25.71% |
| Gross | 39.47% | 38.38% | 34.65% |
| Research & Development to Revenue | 2.03% | 2.32% | 2.39% |
Strong profitability and efficient operations sustain dividend payouts, compounded by strategic investment in R&D, underscoring a robust competitive edge.
Price Development ⬆️
Dividend Scoring System 🏆
| Category | Score | Score Bar |
|---|---|---|
| Dividend yield | 2 | |
| Dividend Stability | 5 | |
| Dividend growth | 3 | |
| Payout ratio | 4 | |
| Financial stability | 5 | |
| Dividend continuity | 5 | |
| Cashflow Coverage | 3 | |
| Balance Sheet Quality | 5 |
Total Score: 32/40
Rating 🎯
In conclusion, West Pharmaceutical Services, Inc. portrays a commendable balance of growth and stability in its dividend strategy, making it a favorable choice for investors seeking reliable, long-term income streams. With robust financial foundations and strategic foresight, the company is well-positioned to continue its tradition of steady, growing dividends. Investors are advised to consider West as part of a diversified dividend portfolio.