October 21, 2025 a 03:31 am
WST: Dividend Analysis - West Pharmaceutical Services, Inc.
West Pharmaceutical Services presents a compelling dividend profile with a rich history of 39 years of uninterrupted dividend payments, demonstrating commitment to returning value to shareholders. With a moderate dividend yield, the focus remains on steady growth and financial health, providing stability amidst market fluctuations. The company's robust financial metrics suggest a strong capability to maintain and potentially enhance future dividend payouts, supported by healthy profitability ratios and a solid balance sheet.
📊 Overview
West Pharmaceutical Services operates in the healthcare sector, providing critical products and solutions to manage pharmaceutical and health-related packaging and delivery systems. Their financial health and strategic positioning offer investors the dual benefit of a stable dividend and potential capital appreciation.
| Sector | Dividend Yield (%) | Current Dividend per Share (USD) | Dividend History (Years) | Last Cut or Suspension |
|---|---|---|---|---|
| Healthcare | 0.31 | 0.81 | 39 | None |
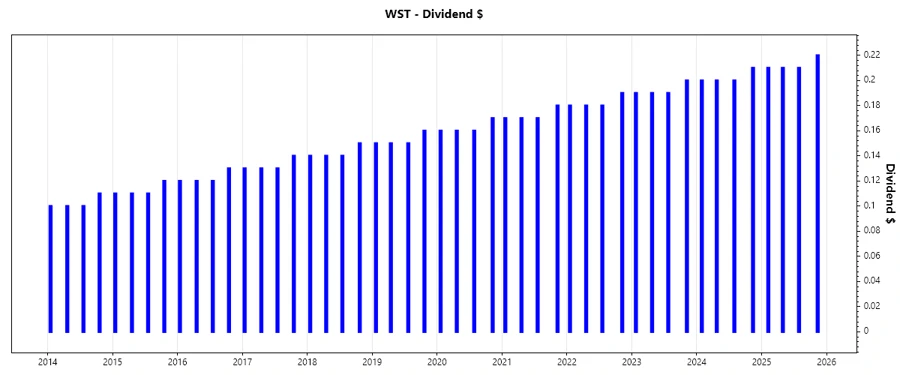
🗣️ Dividend History
Maintaining an unbroken dividend payment track record over 39 years, West Pharmaceutical Services demonstrates remarkable reliability for investors keen on consistent returns. This sustained track record of payouts underlines its financial discipline.
| Year | Dividend per Share (USD) |
|---|---|
| 2025 | 0.85 |
| 2024 | 0.81 |
| 2023 | 0.77 |
| 2022 | 0.73 |
| 2021 | 0.69 |
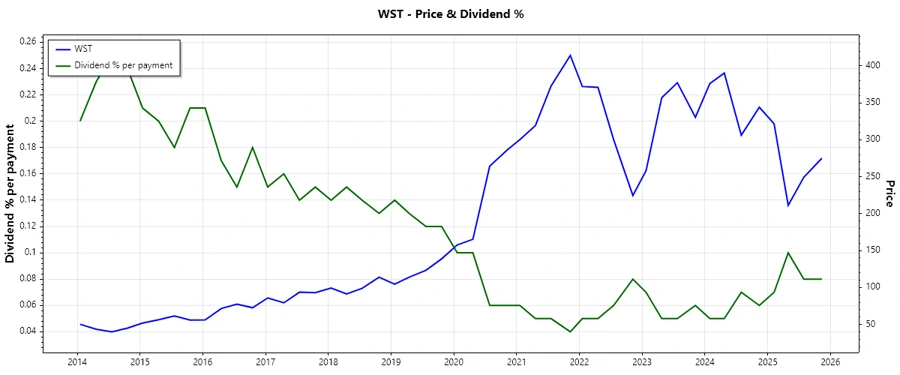
📈 Dividend Growth
The dividend growth metric is vital as it helps investors understand potential future returns. West Pharmaceutical Services exhibits a modest growth in its dividends that underscores the potential for sustainable payouts.
| Time | Growth (%) |
|---|---|
| 3 years | 5.49% |
| 5 years | 5.84% |
The average dividend growth is 5.84% over 5 years. This shows moderate but steady dividend growth.
✅ Payout Ratio
The payout ratio indicates the proportion of earnings and cash flows paid as dividends, which helps assess dividend sustainability.
| Key figure | Ratio (%) |
|---|---|
| EPS-based | 12.00% |
| Free cash flow-based | 16.92% |
This low payout ratio suggests a conservative dividend policy, providing ample room for future increases without overstretching the company's financials.
⚠️ Cashflow & Capital Efficiency
Analyzing cash flow and capital efficiency provides insights into the company’s ability to sustain operations and support growth initiatives.
| Metric | 2024 | 2023 | 2022 |
|---|---|---|---|
| Free Cash Flow Yield | 1.16% | 1.58% | 2.51% |
| Earnings Yield | 2.06% | 2.27% | 3.35% |
| CAPEX to Operating Cash Flow | 57.70% | 46.62% | 39.31% |
| Stock-based Compensation to Revenue | 0.65% | 0.79% | 0.82% |
| Free Cash Flow / Operating Cash Flow Ratio | 42.30% | 53.38% | 60.69% |
The cash flow metrics reflect a well-managed capital strategy that sustains operations and allocates resources effectively, underpinning financial robustness.
📉 Balance Sheet & Leverage Analysis
A strong balance sheet is crucial for supporting dividend sustainability, securing financial flexibility, and withstanding economic volatility.
| Metric | 2024 | 2023 | 2022 |
|---|---|---|---|
| Debt-to-Equity | 11.27% | 10.73% | 11.84% |
| Debt-to-Assets | 8.30% | 8.07% | 8.79% |
| Debt-to-Capital | 10.13% | 9.69% | 10.59% |
| Net Debt to EBITDA | -0.25 | -0.65 | -0.71 |
| Current Ratio | 2.78 | 2.88 | 3.70 |
| Quick Ratio | 2.11 | 2.24 | 2.90 |
| Financial Leverage | 1.36 | 1.33 | 1.35 |
The leverage metrics indicate prudent financial management, with low debt levels enhancing overall financial stability and capacity to weather potential downturns.
📈 Fundamental Strength & Profitability
Profitability ratios provide investors with insights into a company's potential to generate profits relative to revenue, assets, and equity.
| Metric | 2024 | 2023 | 2022 |
|---|---|---|---|
| Return on Equity | 18.37% | 20.60% | 21.82% |
| Return on Assets | 13.52% | 15.50% | 16.20% |
| Net Margin | 17.03% | 20.11% | 20.30% |
| EBIT Margin | 20.34% | 23.95% | 23.83% |
| EBITDA Margin | 25.71% | 28.60% | 28.01% |
| Gross Margin | 34.65% | 38.38% | 39.47% |
| Research & Development to Revenue | 2.39% | 2.32% | 2.03% |
Overall, West Pharmaceutical Services' profitability metrics reveal a robust capability to generate significant returns on assets and equity, underpinning sustainable operational performance and shareholder value.
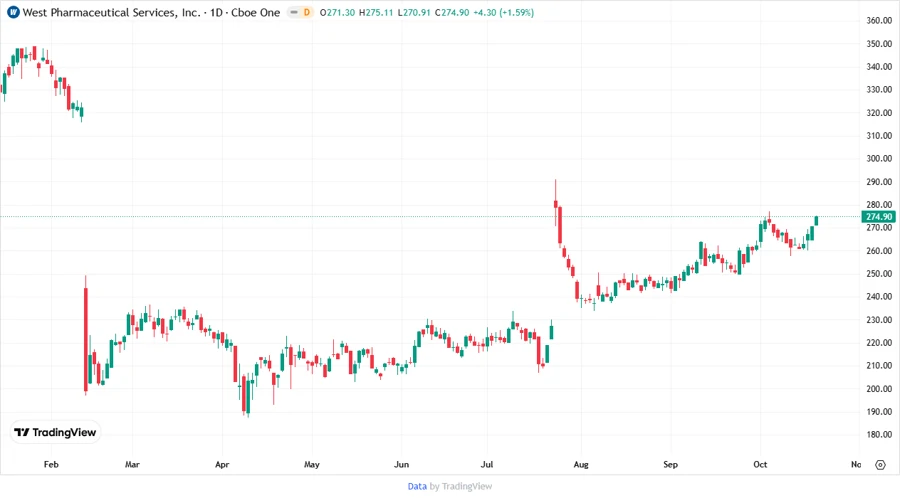
📉 Price Development
📊 Dividend Scoring System
| Criteria | Score | |
|---|---|---|
| Dividend Yield | 3 | |
| Dividend Stability | 5 | |
| Dividend Growth | 3 | |
| Payout Ratio | 4 | |
| Financial Stability | 5 | |
| Dividend Continuity | 5 | |
| Cashflow Coverage | 4 | |
| Balance Sheet Quality | 5 |
Overall Score: 34/40
📉 Rating
West Pharmaceutical Services showcases a stellar dividend profile characterized by uninterrupted history, robust growth potential, and strong financial metrics. The company's commitment to maintaining financial health, combined with proactive management, delivers strong shareholder value. Recommended as a solid option for investors seeking reliable dividend returns alongside capital appreciation.
Smart Data Insight
Master the Perfect Entry & Exit for this Stock
Don't leave your profits to chance. Historically, this stock follows specific seasonal patterns that institutional traders use to maximize returns.
- ✅ Identify the "Golden Buying Window"
- ✅ Avoid high-risk correction cycles
- ✅ Backtested data from the last 20+ years