June 01, 2026 a 08:15 am


WSM: Trend and Support & Resistance Analysis - Williams-Sonoma, Inc.
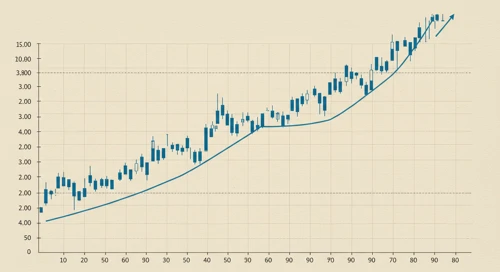
Williams-Sonoma, Inc. has shown a volatile stock performance in recent months, reflected in the trend of its closing prices. The company, a leading specialty retailer in home products, demonstrates its market resilience through diverse brand offerings. Given the price fluctuations and current market conditions, investors should consider both technical indicators and the broader retail environment when evaluating WSM's stock.
Trend Analysis
The recent trend for Williams-Sonoma, Inc. (WSM) has been analyzed in detail using the 20-day and 50-day exponential moving averages (EMA). Based on the data provided, the EMA20 is calculated to be less than the EMA50, indicating a ▼ Abwärtstrend. This is visualized in the table below for the last seven trading days, utilizing color-coded arrows for ease of understanding.
| Date | Close Price | Trend |
|---|---|---|
| 2026-05-29 | 203.57 | ▼ |
| 2026-05-28 | 205.6 | ▶ |
| 2026-05-27 | 203.18 | ▼ |
| 2026-05-26 | 198.38 | ▼ |
| 2026-05-22 | 192.5 | ▼ |
| 2026-05-21 | 191.94 | ▶ |
| 2026-05-20 | 180.25 | ▼ |
This analysis suggests the presence of a bearish momentum, as indicated by the sustained downward movement of closing prices.
Support and Resistance
A detailed analysis of support and resistance zones reveals two major levels for Williams-Sonoma, Inc. The support zones calculated from recent closing prices are 190 - 195 and 175 - 180. Meanwhile, resistance zones have been identified at 205 - 210 and 215 - 220. Current closing prices suggest the stock is above its first support zone but below the first resistance level.
| Zone Type | Zone Range ($) |
|---|---|
| Support 1 | ▼ 190 - 195 |
| Support 2 | ▼ 175 - 180 |
| Resistance 1 | ▲ 205 - 210 |
| Resistance 2 | ▲ 215 - 220 |
This analysis suggests that the stock, currently at a price of 203.57, is approaching the first resistance level, with potential implications for bullish or bearish reversals based on further price movement.
Conclusion
The analysis of Williams-Sonoma, Inc. indicates a predominance of bearish signals based on current moving averages and supports and resistances. While the stock is near a resistance level, this presents a potential opportunity for a bullish breakout if positive momentum continues. However, risks remain, particularly if downward pressure persists, returning the stock to test support zones. For investors, careful consideration of technical indicators, alongside broader market trends and business fundamentals, is crucial in navigating these market conditions.
Smart Data Insight
Master the Perfect Entry & Exit for this Stock
Don't leave your profits to chance. Historically, this stock follows specific seasonal patterns that institutional traders use to maximize returns.
- ✅ Identify the "Golden Buying Window"
- ✅ Avoid high-risk correction cycles
- ✅ Backtested data from the last 20+ years