November 24, 2025 a 01:15 pm
WSM: Trend and Support & Resistance Analysis - Williams-Sonoma, Inc.
Williams-Sonoma, Inc. has demonstrated significant fluctuations over the past months, reflecting the overall volatility in the retail sector. The stock price is influenced by its global presence and diversified product lines, which contribute to a complex financial picture. As of the last available data, investors should be closely monitoring technical indicators to assess future price movements.
Trend Analysis
| Date | Close Price | Trend |
|---|---|---|
| 2025-11-21 | 177.93 | ▼ |
| 2025-11-20 | 172.55 | ▼ |
| 2025-11-19 | 174.62 | ▼ |
| 2025-11-18 | 180.75 | ▲ |
| 2025-11-17 | 181.32 | ▲ |
| 2025-11-14 | 182.24 | ▲ |
| 2025-11-13 | 186.47 | ▲ |
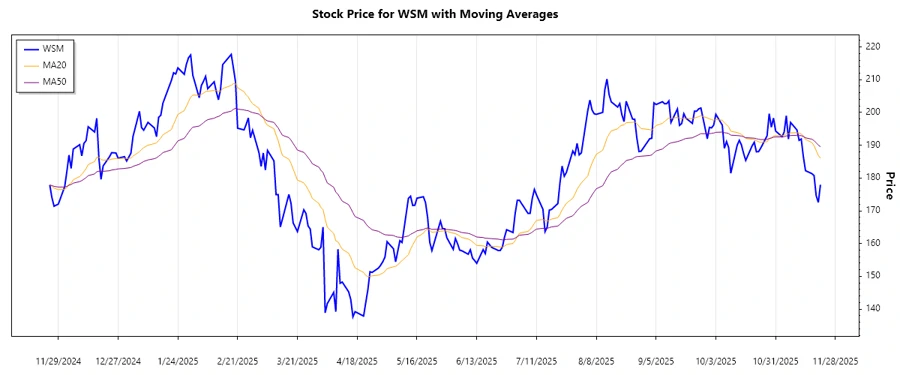
The recent trend indicates an overall downward movement, despite some short-lived upward fluctuations. The EMA calculations reveal a bearish sentiment as EMA20 is below EMA50. This suggests cautious market conditions for the stock in the near-term.
Support and Resistance
| Zone Type | From | To |
|---|---|---|
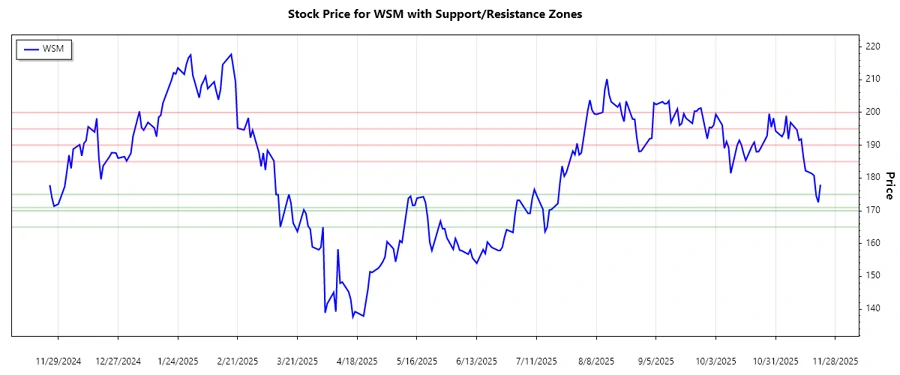
| Support Zone 1 | 171.00 | 175.00 |
| Support Zone 2 | 165.00 | 170.00 |
| Resistance Zone 1 | 185.00 | 190.00 |
| Resistance Zone 2 | 195.00 | 200.00 |
The current price level is within the first support zone, indicating a critical threshold that may see a reaction or reversal in trend. Careful monitoring of these zones offers insights into potential breakout or reversal scenarios.
Conclusion
Williams-Sonoma, Inc. has experienced a series of fluctuations that reflect broader market uncertainties. The technical analysis suggests a bearish trend, underscoring risks for short-term investors. However, the stock remains within strategic support levels, which could present buying opportunities if positive catalysts emerge. Long-term investors might find value considering the company's strong brand presence and diversified offerings, yet should remain vigilant amid the current market volatility.