October 23, 2025 a 10:15 am

WSM: Fibonacci Analysis - Williams-Sonoma, Inc.
Williams-Sonoma, Inc. has demonstrated resilience in a volatile market, marked by its ability to adapt through omni-channel retail strategies. The company's stock has witnessed significant fluctuations but shows signs of recovery. The recent data points towards an emerging technical setup that could offer potential investment opportunities.
Fibonacci Analysis
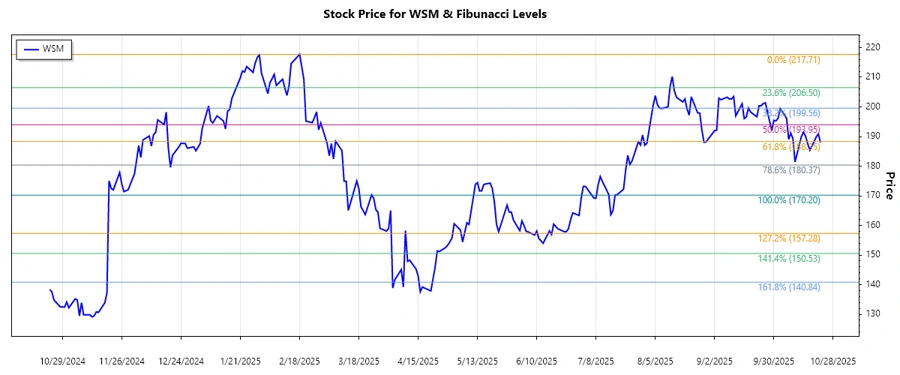
The analysis period reveals a dominant downtrend, beginning in early 2025 and extending into the latter part of the year. The price data shows a significant descent from peak levels during this time.
| Attribute | Details |
|---|---|
| Trend Start Date | 2025-02-18 |
| Trend End Date | 2025-10-22 |
| High Price & Date | $217.71 on 2025-02-18 |
| Low Price & Date | $170.2 on 2025-07-17 |
| Fibonacci Level | Price |
|---|---|
| 0.236 | $183.68 |
| 0.382 | $192.14 |
| 0.5 | $193.96 |
| 0.618 | $202.29 |
| 0.786 | $212.01 |
Current analysis indicates that the stock price of $187.99 is in the 0.236 retracement zone, suggesting potential support at this level. This positioning may attract buyers, setting the stage for a trend reversal or consolidation.
Conclusion
The downtrend in Williams-Sonoma, Inc.'s stock is evident, yet current data suggests stabilization. With the price sitting at a key Fibonacci level, investors could see this as a potential entry point for long positions if supportive actions occur. However, caution is advised as further declines could ensue if economic headwinds persist, impacting consumer spending in the retail sector. The stock's performance should be monitored closely as it navigates these levels.
Smart Data Insight
Master the Perfect Entry & Exit for this Stock
Don't leave your profits to chance. Historically, this stock follows specific seasonal patterns that institutional traders use to maximize returns.
- ✅ Identify the "Golden Buying Window"
- ✅ Avoid high-risk correction cycles
- ✅ Backtested data from the last 20+ years