September 07, 2025 a 05:15 am
WSM: Fibonacci Analysis - Williams-Sonoma, Inc.
Williams-Sonoma, Inc. continues to navigate the retail sector with its diverse range of home products. Over recent months, its stock has demonstrated resilience amid market fluctuations. The recent analysis identifies a dominant uptrend, which offers insights into potential retracement levels critical for investment strategies.
Fibonacci Analysis
| Detail | Value |
|---|---|
| Start Date | 2025-04-21 |
| End Date | 2025-09-05 |
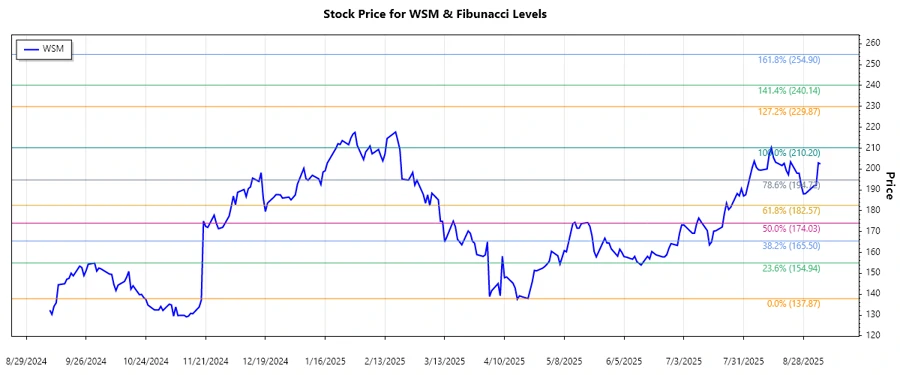
| High Point | 210.2 on 2025-08-13 |
| Low Point | 137.87 on 2025-04-21 |
| Fibonacci Level | Price Level |
|---|---|
| 0.236 | 164.96 |
| 0.382 | 175.13 |
| 0.5 | 184.04 |
| 0.618 | 192.95 |
| 0.786 | 204.78 |
The current price of 202.42 is within the 0.786 retracement level. This could indicate a strong support area, suggesting potential price consolidation before a further uptrend continuation.
Conclusion
The recent uptrend in Williams-Sonoma stock illustrates its capacity to build value within the retail market. The stock is presently poised within the higher retracement level, which often signals momentary stabilization or a possible reversal. This situation offers both potential support for bullish positions and caution for bear-centric strategies. For technical analysts, the Fibonacci levels provide a roadmap for future price movements, marking significant zones of price action interest. The current dynamics suggest vigilance for emerging market trends and readiness for swift adjustments.
Smart Data Insight
Master the Perfect Entry & Exit for this Stock
Don't leave your profits to chance. Historically, this stock follows specific seasonal patterns that institutional traders use to maximize returns.
- ✅ Identify the "Golden Buying Window"
- ✅ Avoid high-risk correction cycles
- ✅ Backtested data from the last 20+ years