November 11, 2025 a 07:31 am
WSM: Dividend Analysis - Williams-Sonoma, Inc.
Williams-Sonoma, Inc. shows a steady commitment to its shareholders with a notable history of dividend payments spanning over 20 years. Its current market position, along with strong earnings and cash flow metrics, indicates a stable dividend outlook. The company's moderate dividend yield reflects its strategic balance between growth initiatives and shareholder returns.
Overview
The following table outlines key dividend metrics for Williams-Sonoma, Inc., highlighting its sector positioning and historical dividend performance:
| Metric | Details |
|---|---|
| Sector | Consumer Discretionary |
| Dividend yield | 1.38 % |
| Current dividend per share | 2.22 USD |
| Dividend history | 20 years |
| Last cut or suspension | None |
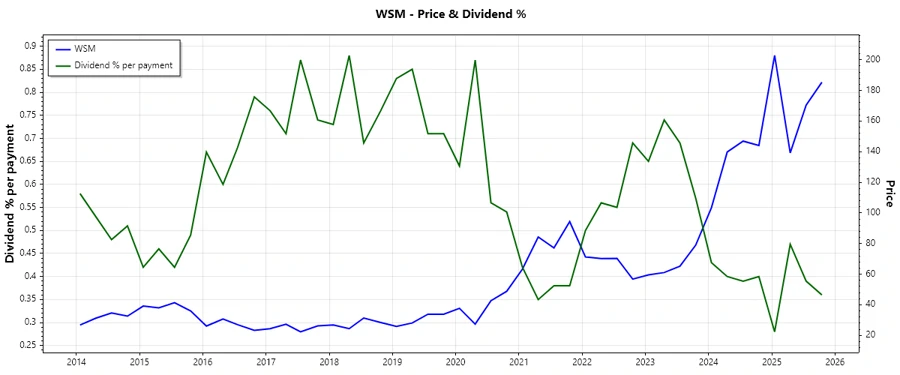
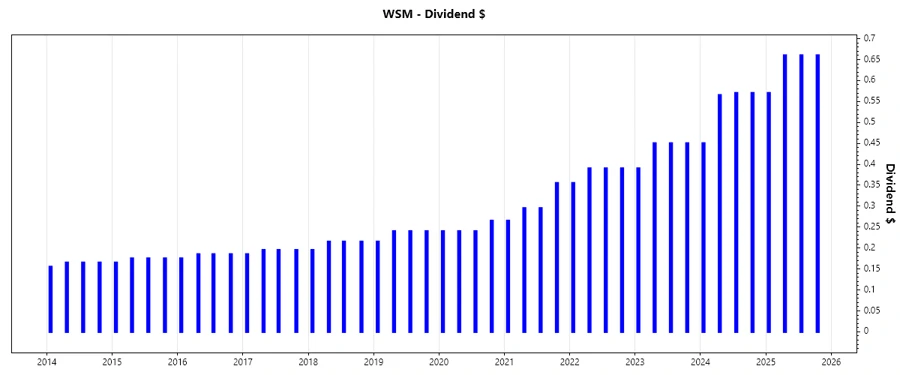
Dividend History
Williams-Sonoma has a solid history of increasing dividends, underscoring its commitment to rewarding shareholders regularly. This historical performance is a critical factor for investors seeking consistent returns.
| Year | Dividend Per Share (USD) |
|---|---|
| 2025 | 2.55 |
| 2024 | 2.155 |
| 2023 | 1.74 |
| 2022 | 1.525 |
| 2021 | 1.21 |
Dividend Growth
Analyzing dividend growth helps investors understand the company's ability to increase shareholder value over time. Williams-Sonoma has maintained steady dividend growth, reflecting a strong commitment to reward shareholders.
| Time | Growth |
|---|---|
| 3 years | 21.21 % |
| 5 years | 18.18 % |
The average dividend growth is 18.18 % over 5 years. This shows moderate but steady dividend growth.
Payout Ratio
Payout ratios provide insights into the sustainability of a company's dividend payments relative to earnings and cash flow. A conservative payout ratio typically indicates that the company retains sufficient earnings for reinvestment and future growth.
| Key Figure | Ratio |
|---|---|
| EPS-based | 24.35 % |
| Free cash flow-based | 26.63 % |
With a 24.35 % EPS payout ratio and a 26.63 % FCF payout ratio, Williams-Sonoma maintains a conservative approach, preserving the potential for sustainable dividend growth.
Cashflow & Capital Efficiency
Understanding cash flows and capital efficiency metrics offers insights into a company's financial health. High free cash flow and efficient capital use signify robust underlying business operations capable of supporting dividends.
| 2022 | 2023 | 2024 | |
|---|---|---|---|
| Free Cash Flow Yield | 4.28 % | 11.95 % | 4.27 % |
| Earnings Yield | 12.29 % | 7.61 % | 4.22 % |
| CAPEX/OFCF | 33.64 % | 11.22 % | 16.29 % |
| Stock Compensation/Revenue | 1.04 % | 1.09 % | 1.28 % |
| FCF/OCF Ratio | 66.36 % | 88.78 % | 83.71 % |
Williams-Sonoma's stable cash flow and capital efficiency metrics suggest a strong potential to maintain and grow dividends without jeopardizing operational productivity.
Balance Sheet & Leverage Analysis
This section evaluates the company's leverage and liquidity, providing an understanding of its capacity to manage debt and sustain operations. A healthy balance sheet supports dividend payments by reducing financial risks.
| 2022 | 2023 | 2024 | |
|---|---|---|---|
| Debt-to-Equity | 0.85 | 0.65 | 0.63 |
| Debt-to-Assets | 0.31 | 0.26 | 0.25 |
| Net Debt to EBITDA | 0.63 | 0.09 | 0.08 |
| Current Ratio | 1.24 | 1.45 | 1.50 |
| Quick Ratio | 0.35 | 0.78 | 0.74 |
| Financial Leverage | 2.74 | 2.48 | 2.47 |
Williams-Sonoma maintains a solid balance sheet with a manageable level of debt, allowing for operational stability and flexibility necessary for consistent dividend payouts.
Fundamental Strength & Profitability
Evaluating fundamental strength alongside profitability ratios presents a view of how efficiently a company can convert operations and assets into profits, crucial for sustaining and potentially increasing dividends.
| 2022 | 2023 | 2024 | |
|---|---|---|---|
| Return on Equity | 66.31 % | 44.63 % | 52.52 % |
| Return on Assets | 24.19 % | 18.01 % | 21.22 % |
| Net Margin | 13.00 % | 12.25 % | 14.59 % |
| Gross Margin | 42.40 % | 42.62 % | 46.45 % |
| R&D to Revenue | 0 % | 0 % | 0 % |
Williams-Sonoma's consistent profitability and robust return on equity indicate efficient capital use, reinforcing its ability to continue rewarding shareholders through dividends.
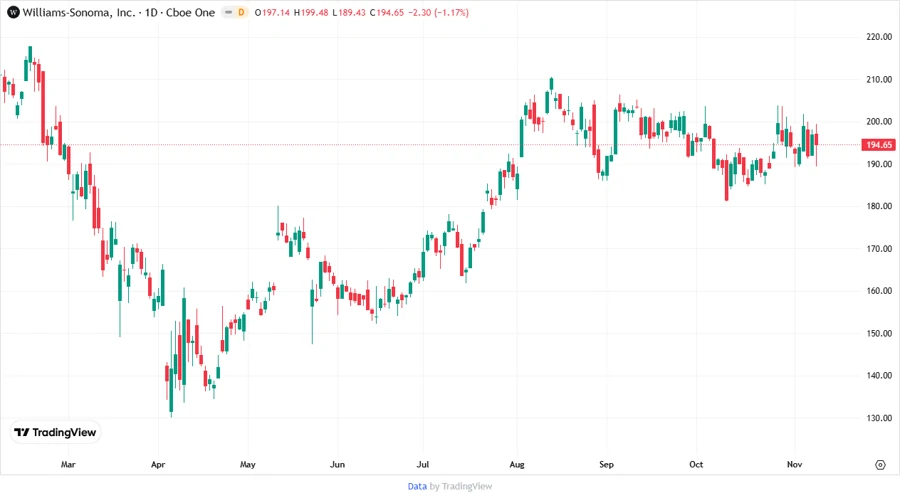
Price Development
Dividend Scoring System
| Criterion | Score | Description |
|---|---|---|
| Dividend yield | 3 | |
| Dividend Stability | 5 | |
| Dividend growth | 4 | |
| Payout ratio | 5 | |
| Financial stability | 4 | |
| Dividend continuity | 5 | |
| Cashflow Coverage | 4 | |
| Balance Sheet Quality | 4 |
Overall Score: 34/40
Rating
Williams-Sonoma, Inc. offers a strong dividend profile characterized by a very stable dividend history and robust coverage by earnings and cash flows. The company's efficient capital management and solid financials position it favorably among dividend-paying stocks. Investors seeking steady income with growth opportunities may find this stock appealing. Recommended as a strong buy for long-term dividend investors.
Smart Data Insight
Master the Perfect Entry & Exit for this Stock
Don't leave your profits to chance. Historically, this stock follows specific seasonal patterns that institutional traders use to maximize returns.
- ✅ Identify the "Golden Buying Window"
- ✅ Avoid high-risk correction cycles
- ✅ Backtested data from the last 20+ years