October 04, 2025 a 04:03 am


WRB: Trend and Support & Resistance Analysis - W. R. Berkley Corporation
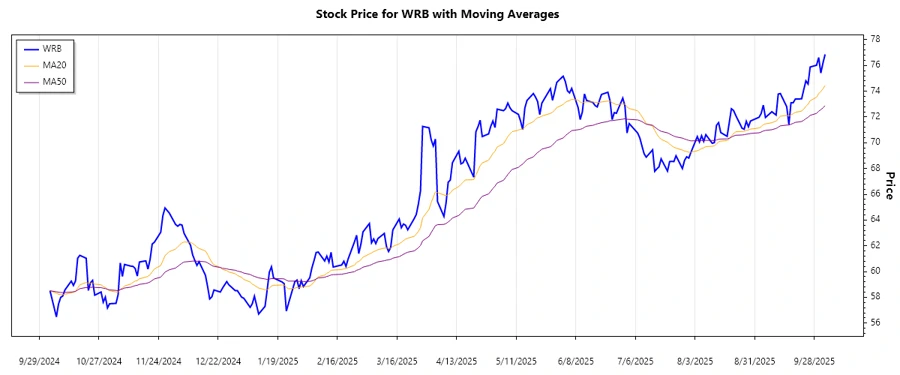
The WRB stock has shown significant price movements in recent months, reflecting the dynamic changes in the insurance and reinsurance markets. This analysis aims to provide a comprehensive view of current trends and key support & resistance zones for potential trading opportunities. Investors should note that while the stock has been experiencing fluctuations, understanding trend directions and key price levels can aid in making informed investment decisions.
Trend Analysis
The financial data indicates a general upward movement in the WRB stock with calculated EMA values showing consistent growth over time. The recent data exhibits the following trend analysis:
| Date | Close Price | Trend |
|---|---|---|
| 2025-10-03 | 76.86 | ▲ |
| 2025-10-02 | 76.18 | ▲ |
| 2025-10-01 | 75.41 | ▲ |
| 2025-09-30 | 76.62 | ▲ |
| 2025-09-29 | 76.02 | ▲ |
| 2025-09-26 | 75.88 | ▲ |
| 2025-09-25 | 74.56 | ▲ |
The current trend is a consistent upward movement, potentially indicating a strong bullish sentiment in the market. Traders and investors may consider this as an opportunity for potential gains.
Support and Resistance
Upon analyzing the WRB stock data for critical support and resistance levels, the following zones were identified:
| Zone Type | From | To |
|---|---|---|
| Support Zone 1 | 73.00 | 74.00 |
| Support Zone 2 | 68.00 | 69.00 |
| Resistance Zone 1 | 77.50 | 78.50 |
| Resistance Zone 2 | 75.00 | 76.00 |
Currently, the WRB stock is hovering near the Resistance Zone 2, which might suggest potential difficulty in breaking higher without significant momentum.
Conclusion
In conclusion, the WRB stock displays an upward trend in recent data, bolstered by consistent EMA values. Despite current challenges near the resistance levels, the bullish sentiment remains strong. Investors should watch for signs of market momentum or divergence from current trends. Support levels provide firm ground for potential pullbacks, creating opportunities for buying at lower prices. Overall, caution is advised as the market responds to broader economic conditions that might affect this sector.
Smart Data Insight
Master the Perfect Entry & Exit for this Stock
Don't leave your profits to chance. Historically, this stock follows specific seasonal patterns that institutional traders use to maximize returns.
- ✅ Identify the "Golden Buying Window"
- ✅ Avoid high-risk correction cycles
- ✅ Backtested data from the last 20+ years